Global Warming Science - www.appinsys.com/GlobalWarming
Hurricane Alarmists / Jay Inslee: Scaremonger
[last update: 2017/09/12]
|
Hurricanes Bring Out the Extremists
“No Place For Climate Change Deniers To Hide”, according to Jay Inslee (Governor of Washington State, writing for the Huffington Post: “…we will call out the climate denial of our rivals, not as some peripheral and modest comment but a fundamental flaw that should disqualify candidates from public office.”Inslee believes “climate denial” is grounds for disqualifying political candidates! “We can no longer look at climate change as a second-tier issue, relegated to something confined to the environmental community. It must drive our policy and our politics in every realm and in every constituency and in every debate.”
“Inslee argued that it was "likely" and "fair" that global warming increased the strength of Hurricanes Harvey and Irma” [http://www.cnn.com/2017/09/11/politics/jay-inslee-axe-files-axelrod/index.html]
Hurricane scientists disagree:
University of Washington climate scientist, Cliff Mass, states: “It is more than a little disturbing. Before the rains had ended, dozens of media outlets had published stories suggesting that global warming forced by humans (mainly by emissions of CO2 into the atmosphere) played a significant role in producing the heavy rainfall and resulting flooding associated with Hurricane Harvey.” [http://cliffmass.blogspot.com/2017/08/global-warming-and-hurricane-harvey.html]
After showing the actual scientific data in the above article, Mass states: “I could show you a lot more, but bottom line in all this
is: And: “The bottom line in this analysis is that both observations
of the past decades and models looking forward to the future do not suggest
that one can explain the heavy rains of Harvey by global warming, and
folks that are suggesting it are poorly informing the public and decision
makers.
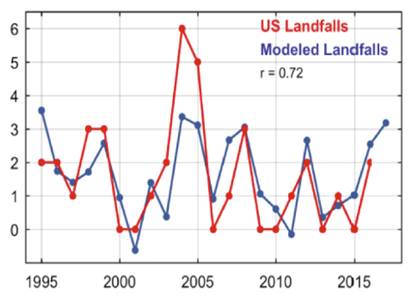
The following figure shows that US hurricane landfalls have been declining over the last 20 years: [https://judithcurry.com/2017/06/08/cfans-forecast-for-the-2017-atlantic-hurricane-season/]
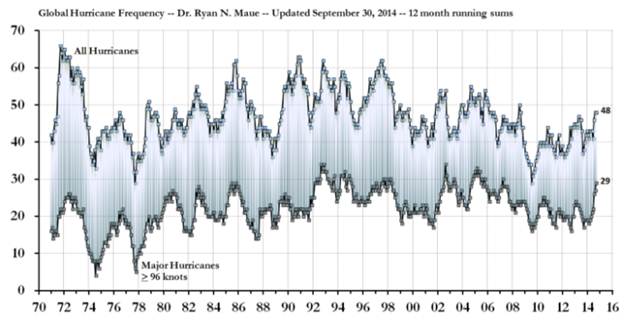
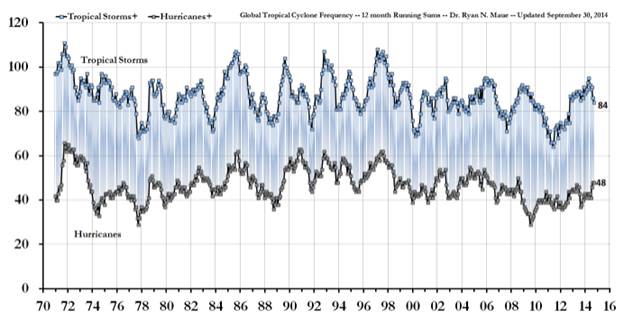
The following figures show global hurricane frequency since 1970 – the global frequency has been declining slightly for more than 20 years. http://policlimate.com/tropical/
What about non-hurricane storms? No increase in tropical storms either.
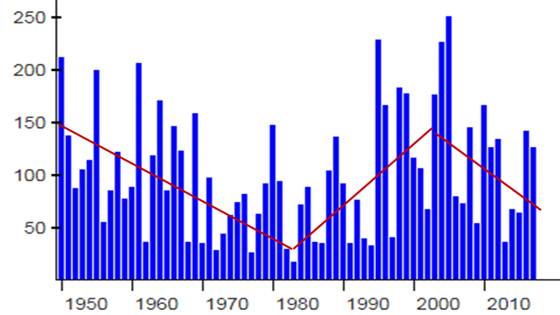
The following figure shows the global accumulated cyclone energy (ACE) since 1950. [https://en.wikipedia.org/wiki/Accumulated_cyclone_energy]
Yet atmospheric CO2 keeps going up – with zero effect on frequency or total energy of storms.
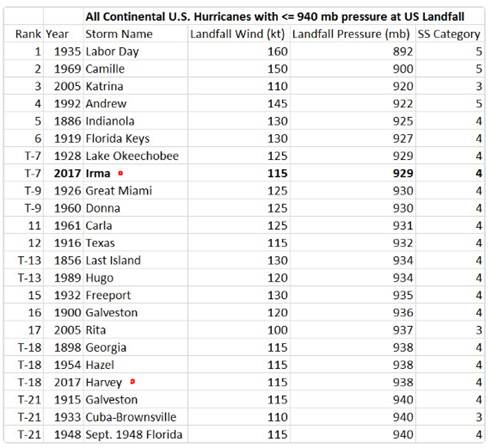
The following table is from Phil Klotzbach, hurricane expert at Colorado State University, showing Irma and Harvey’s place in the list of major hurricanes [https://twitter.com/philklotzbach/status/906881395057844225]:
For more info on global hurricane data, see: http://appinsys.com/GlobalWarming/GW_4CE_Hurricanes.htm
For recent hurricane reporting see: and
Inslee isn’t the only alarmist claiming hurricanes are worse due to global warming .
The Nation thinks we can stop hurricanes: “How many times must we see this disaster movie—titled Hurricane Harvey in 2017, Hurricane Sandy in 2012, and Hurricane Katrina in 2005, along with many lesser- known foreign releases—before we intervene and change the ending?” [https://www.thenation.com/article/climate-denialism-is-literally-killing-us/]
Bill Nye the (anti-)science guy gets it wrong too: “It’s the strength that is almost certainly associated with global warming”
And as always the New York Times promotes the global warming lies: “If this isn’t climate change, I don’t know what is. This is a truly, truly poster child for what is to come.” and “For scientists, drawing links between warming global temperatures and the ferocity of hurricanes is about as controversial as talking about geology after an earthquake.”- Wrong! – Not a single scientist expert in hurricanes attributes them to global warming. [https://www.nytimes.com/2017/09/11/climate/hurricane-irma-climate-change.html?mcubz=0]
Jay Inslee, touted as the nation’s “greenest state leader”, and promoting a cap-and-trade system in Washington State, said in 2015: “Climate change is ravaging my state”. [http://grist.org/climate-energy/washington-governor-jay-inslee-cap-and-trade-carbon-tax/]
|
|
Washington State
Temperature
Ravaging Temperatures? (Maybe because the past is getting colder in Washington State!)
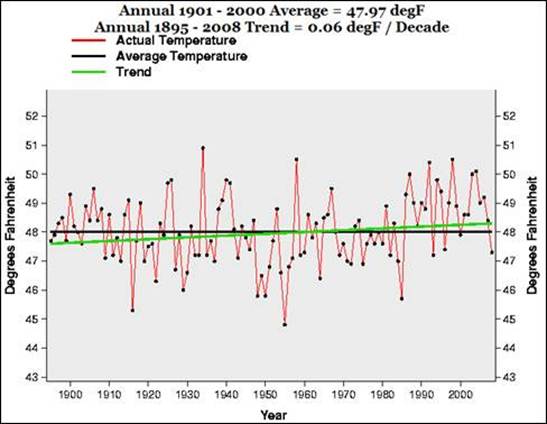
The following graph is from a study of Washington’s climate in 2010 and was made using the NOAA / NCDC data graphing website. See [http://appinsys.com/globalwarming/RS_Washington_usa.htm] for details.
NOAA / NCDC have since changed their data graphing website (as well as the data). The new graphing website is here: https://www.ncdc.noaa.gov/cag/
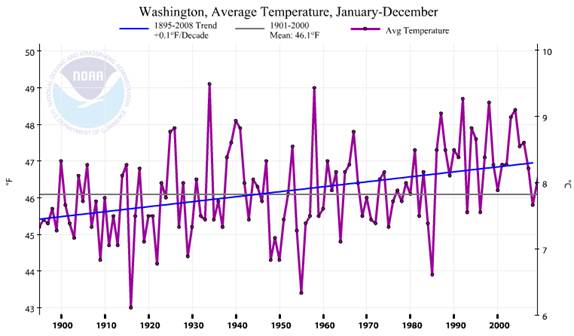
The following graph shows the “same” data as the above graph for the same historical period (except that NOAA has changed the data to increase the artificial warming).
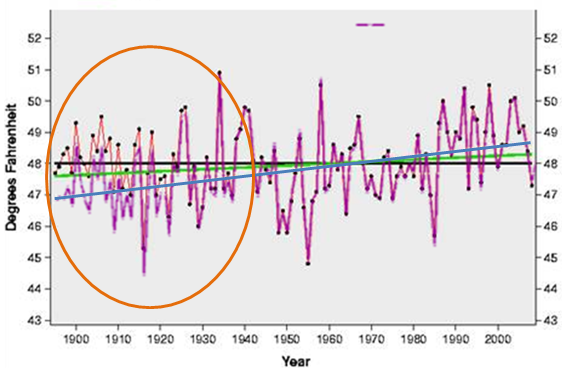
The following graph superimposes the new NOAA graph on top of the old.
NOAA has made the past colder in the early 1900s. This creates an artificial warming trend. In 2010 they said the trend was 0.06 degrees F per decade (0.6 degrees per century) – now they say it was 0.1 degrees F per decade. And the average annual temperature for the period 1901 – 2000 decreased from 47.97 to 46.1
The government promoters of the global warming scare have chilled the past to make the present seem warmer!
Sea Level
Ravaging sea level ?
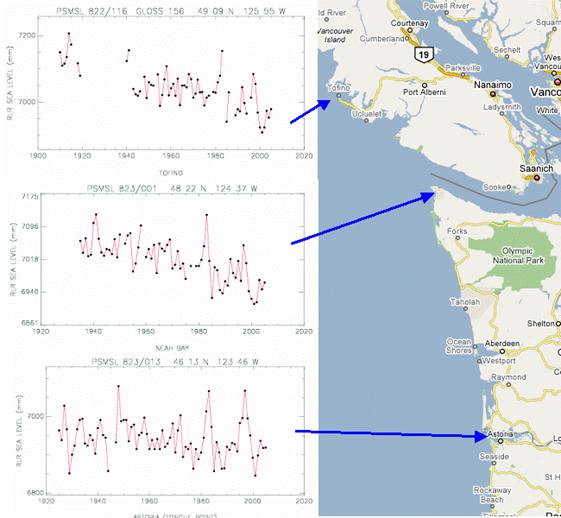
The following figure is from [http://appinsys.com/globalwarming/RS_Washington_usa.htm] using data from the PMSL. Seal level in Washington state is “falling” due to isostatic rebound since the last ice age.
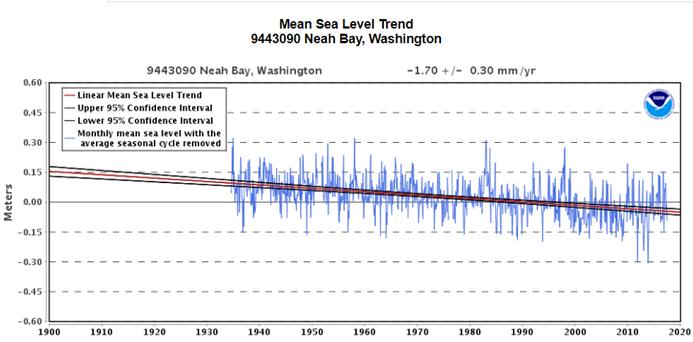
The following figure provides an updated view of sea level at Neah Bay – the only sea level station on the west coast of Washington [https://tidesandcurrents.noaa.gov/sltrends/sltrends_station.shtml?stnid=9443090]
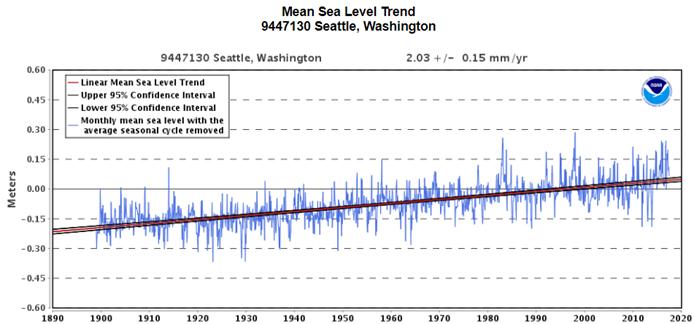
Yet Inslee says “according to studies that estimate that sea levels in Seattle will rise 7 inches by 2050 and 24 inches by 2100” [http://www.governor.wa.gov/issues/issues/energy-environment/climate-impacts-washington-state]
Here is a plot of sea level at Seattle (from the same NOAA website). Seattle is on the narrow Puget Sound – not open ocean, and is affected by river inflows to the sound, land subsidence, etc. At the observed trend of 2.03 mm per year, it will take about 87 years for the sea level to increase by 7 inches. That would be about the year 2100 – i.e. when Inslee says it will have increased by 24 inches!
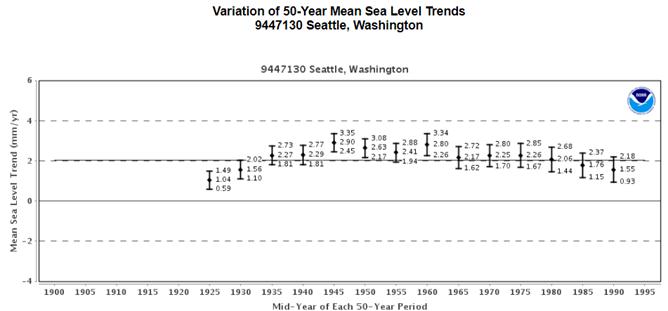
The following figure from the same website shows the variation in Seattle 50-year sea level trends. The trends were higher in the 1940s and 50s.
Wildfires
Ravaging wildfires?
Alarmists like to portray wildfires like this:
[http://www.motherjones.com/environment/2014/06/shirley-fire-budget-climate-change/]
Somehow a lot of the past tends to get ignored.
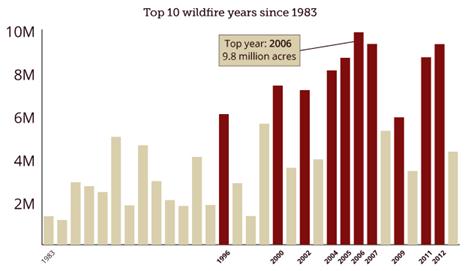
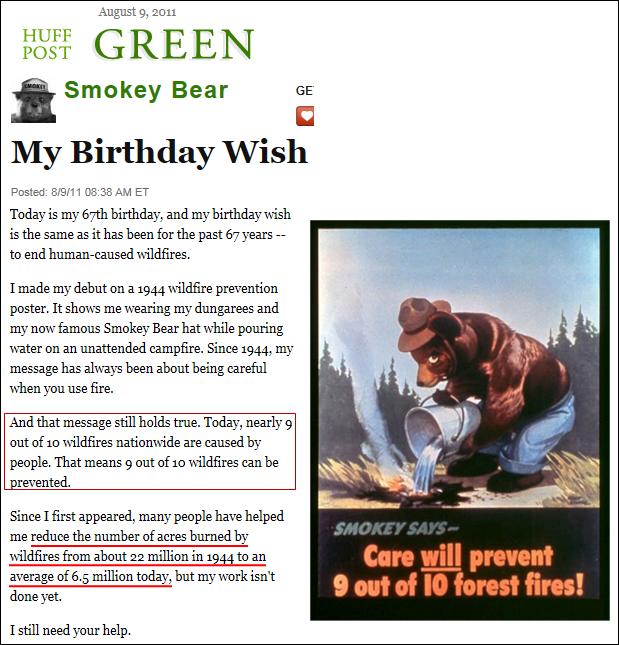
In 2011 Huffington Post celebrated Smokey Bear’s birthday. Smokey said: the number of acres burned by wildfire has been reduced from “about 22 million in 1944 to an average of 6.5 million today”:
[http://www.huffingtonpost.com/smokey-bear/my-birthday-wish_b_921732.html]
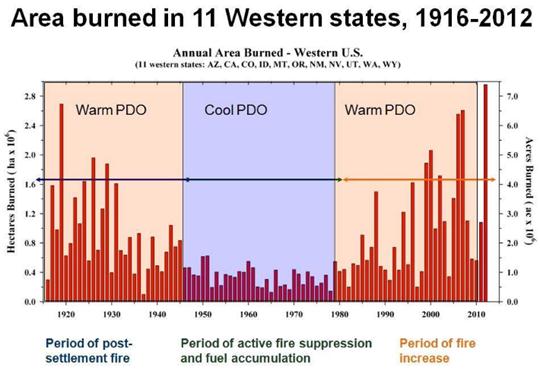
When long term data are viewed, a different picture emerges:
A 2000 report to President Clinton stated: “As a result of the all-out effort to suppress fires, the annual acreage consumed by wildfires in the lower 48 states dropped from 40 to 50 million acres a year in the early 1930s to about 5 million acres in the 1970s. During this time, firefighting budgets rose dramatically and firefighting tactics and equipment became increasingly more sophisticated and effective. In short, decades of aggressive fire suppression have drastically changed the look and fire behavior of Western forests and rangelands. As a result, studies show that today’s wildfires typically burn hotter, faster, and higher than those of the past.” [http://www.fs.fed.us/emc/hfi/president.pdf]
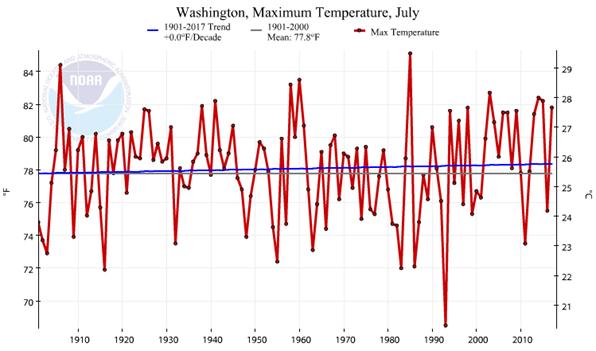
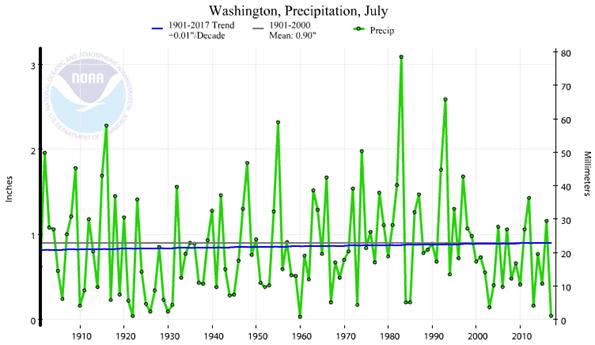
Meanwhile, the trends in Washington State maximum July temperatures and July precipitation have not significantly changed over the last century: [https://www.ncdc.noaa.gov/cag/]
|
|
|
|
Inslee is Anti-Science
A Shift article on Inslee, “Inslee ignores science to advance his political agenda” states: “The facts have not—and will not—prevent Inslee from making his unscientific assertions in order to justify and advance his political agenda. There is a clear contradiction between scientific truth and Inslee’s truth.” … “Whether it’s the deliberate use of outdated, flawed studies to justify his plans or simply ignoring verified facts to advance his political goals, Inslee has proved he will not let science stand in the way of his extreme environmental agenda.” [https://shiftwa.org/inslee-ignores-science-to-advance-his-political-agenda/]The above article also refers to Inslee’s nonsense about dying oysters: “the New York Times profiled Inslee’s campaign to implement his carbon reduction plan. The Times wrote, “Billions of baby oysters in the Pacific inlets here are dying and Gov. Jay Inslee of Washington is busy spreading the bad news.” Inslee himself stated, “It used to be the canary in the coal mine. Now it’s the oyster in the half shell. You can’t overstate what this means to Washington.””(The oyster issue was examined in detail in this article also highlighting the big green money flows: http://appinsys.com/GlobalWarming/InsleesBillions.htm)
Inslee is also confused about what the term “carbon pollution” refers to. [The greenies started referring to their favorite greenhouse gas, CO2, as “carbon pollution” in order to confuse the situation (and to demonize the odorless, non-poisonous gas) – although I don’t think they are referring to diamonds (pure carbon), or any of the other millions of forms of carbon.] From Inslee’s website link in the previous section: “The heavy trucks that use Highway 99 and other freeways fill the air with exhaust particles carrying benzene, formaldehyde and other toxins. The result: Chronic asthma rates in South Park and the greater Duwamish Valley are higher than in any other neighborhood in King County.” … And the caption for a picture of his meeting with the South Park residents: “Leaders in the South Park neighborhood discuss health concerns related to carbon pollution in their community.” Exhaust particles are genuine carbon pollution, but that is not what the greenies refer to with the term, but rather CO2 as causing climate change. The greenies’ desire for biofuels actually creates this worse particulate carbon pollution – see: http://appinsys.com/globalwarming/EPA_Biofuels.htm
See also: https://shiftwa.org/inslee-delivers-laughable-climate-change-speech-again/
|