Global Warming Science - www.appinsys.com/GlobalWarming
Wisconsin, USA
[last update: 2010/07/04]
|
[2010/01/20] The Governor’s Task Force on Global Warming (Governor Jim Doyle – D) produced a ridiculous bill (AB 649) – see details at: http://www.appinsys.com/GlobalWarming/WisconsinAB649.htm
|
|
Temperatures
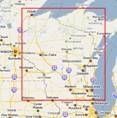
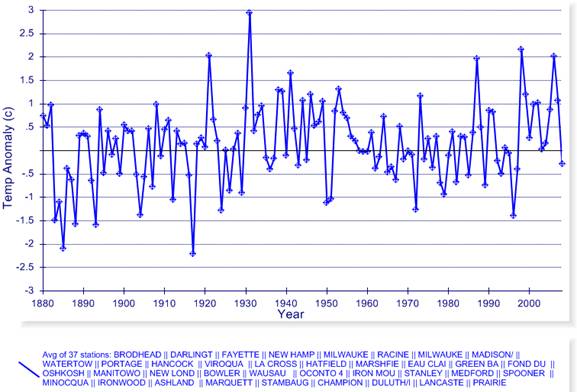
The following figure shows annual average temperature anomalies for the 37 long-term stations in the rectangle indicated (bounded by 42.5-47N x 87-92.5W) in the NOAA GHCN database. Although there are a few non-Wisconsin stations included in the rectangular area, it is still representative of the state. This data is plotted from http://www.appinsys.com/GlobalWarming/climate.aspx.
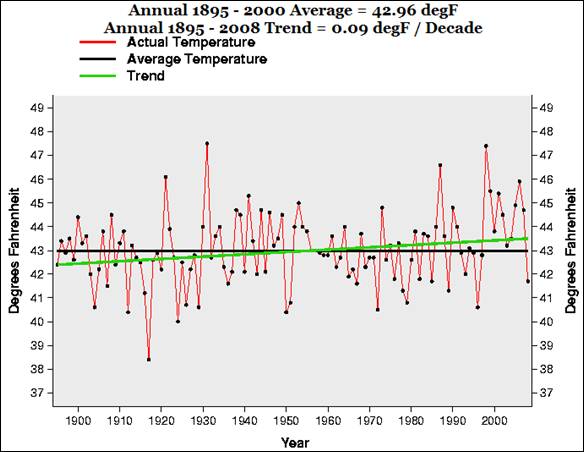
The following figure shows annual average temperature for Wisconsin from the NCDC database, showing the same result as above [http://www.ncdc.noaa.gov/oa/climate/research/cag3/wi.html].
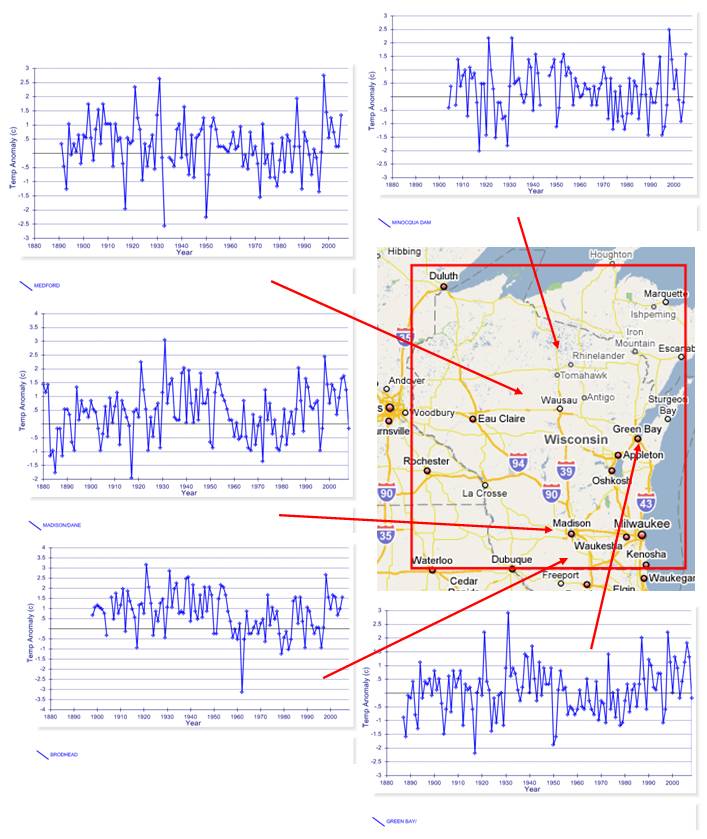
The following figure shows annual average temperature anomalies for the 5 of the long-term stations in Wisconsin from the NOAA GHCN database, including two urban stations (Madison and Green Bay) and three rural stations (Minoqua Dam, Medford and Brodhead). Recent warming has not surpassed that of the 1930’s except for 1998 – which was caused by the extreme El Nino.
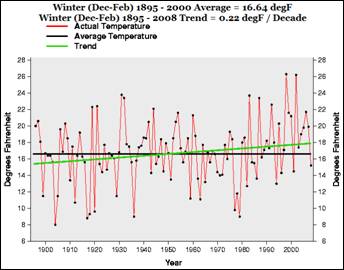
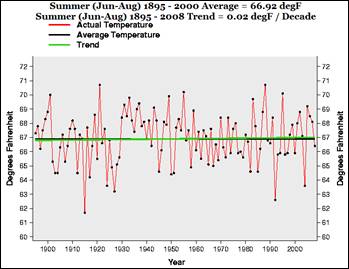
The following figures show the annual winter temperature for Wisconsin (left) and summer temperature (right) from the NCDC database. All of the warming trend has been in the winter, not in the summer.
|
|
Precipitation
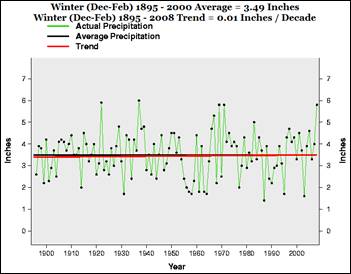
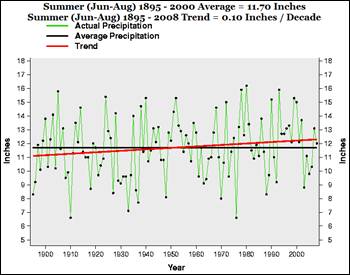
The following figures show the annual winter total precipitation for Wisconsin (left) and summer total precipitation (right) from the NCDC database. There is no trend for the winter, with slightly increasing trend for the summer.
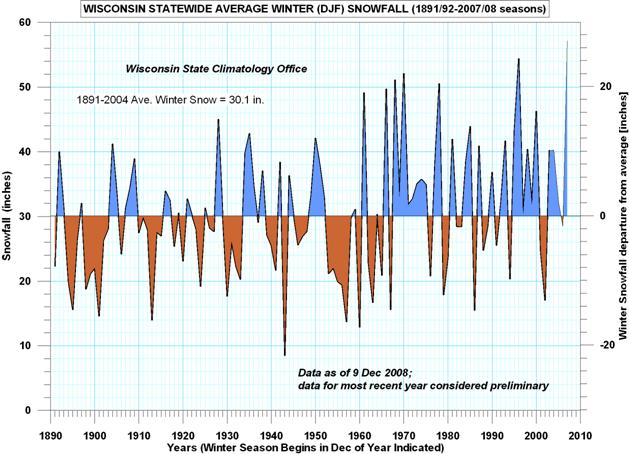
The following figure shows the statewide average snowfall [http://www.aos.wisc.edu/~sco/seasons/graphics/WI-00-snow-djf.gif]. There is a trend to increasing snowfall in recent decades.
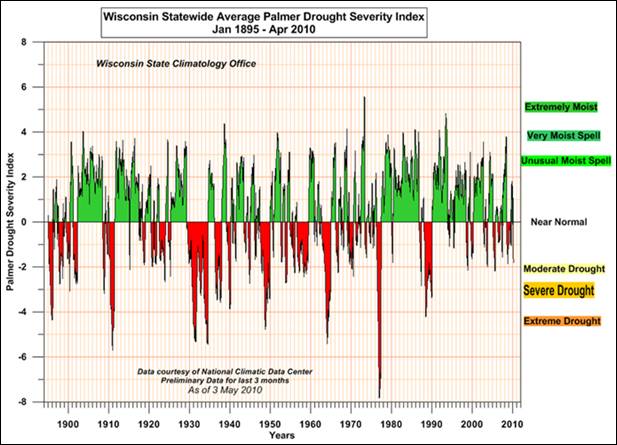
The following figure shows the Palmer Drought Severity Index from 1895 to April 2010 for Wisconsin. There has not been an increase in drought duration or severity during the second half of the 20th century.
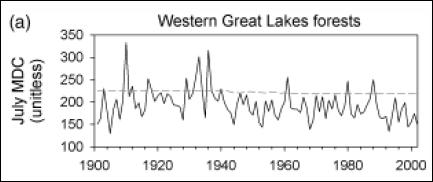
A study of wildfire risk based on the July Monthly Drought Code (MDC) shows decreased wildfire risk over the “global warming era” of the 20th century. [http://www.umr5059.univ-montp2.fr/IMG/pdf/49_Girardin_etal_GCB09.pdf]
|