Global Warming Science - www.appinsys.com/GlobalWarming
Western North America
[last update: 2009/02/02]
|
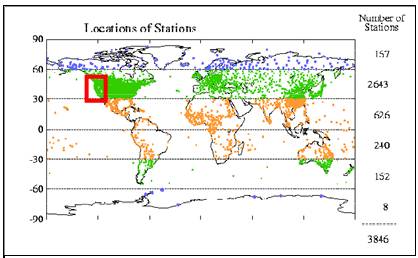
There are many stations in western North America, mainly in the U.S. Many Canadian stations in the region do not have recent temperatures in the GHCN.
|
|
The following figures show averaged gridded temperature data from the GHCN database (left) and then the same temperature data superimposed on the IPCC models (right - from the IPCC AR4: pink= models with anthropogenic CO2, blue= models without CO2, black= “observed”).
|
|
GISS Temperature Data
The following are from a selection of stations in the GISS database that have long-term data:
Urban:
Everett is shown rather than Seattle since Seattle does not have a station with long-term data from before 1930 to the present. The urban stations are obviously influencing the averages shown previously.
The rural stations show quite a different trend from the urban stations.
Rural:
The following provides a comparison of four southwest cities, each with a nearby rural station.
Las Vegas, NV
Phoenix, AZ
Tucson, AZ
Los Angeles, CA
The following figures show San Diego temperature trend (from NOAA database) combined with La Jolla CO2 data (from CDIAC) for 1968 to 2006.
|
|
Sea Level
The following figure shows the sea level trends at various locations along the coast of western North America.
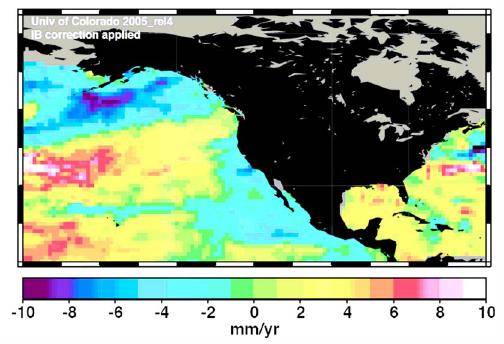
The following figure shows sea level change from 1993-2005 from satellite data [http://oaspub.epa.gov/eims/eimscomm.getfile?p_download_id=446967]
|
|
Pacific Decadal Oscillation (PDO)
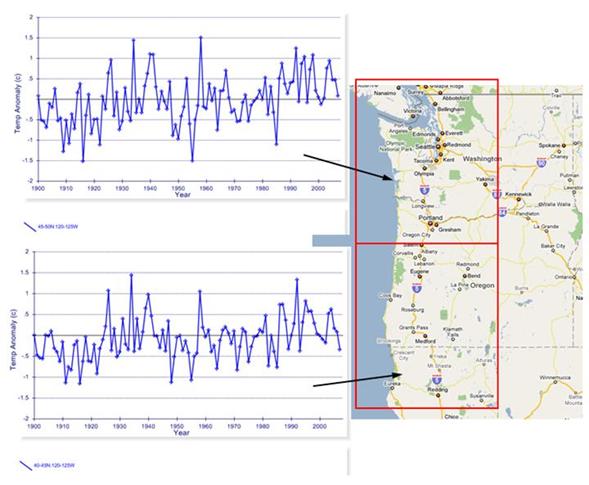
The following figure shows the annual mean temperature anomalies for the two 5x5 degree grids covering the Pacific Northwest coast of the U.S. -- western Oregon and Washington from 1900 to 2007. This data is from the Hadley Climatic Research Unit (HadCRU) as used by the IPCC.
The following figure shows the average of the two grids shown above superimposed on the Pacific Decadal Oscillation (PDO). A strong correlation exists between the PNW coastal temperatures and the PDO.
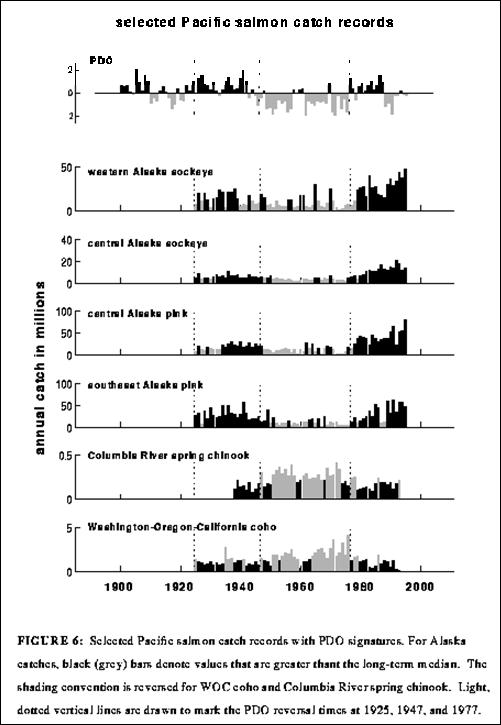
The following figure is from a study of the impacts of the PDO on salmon production. It shows a positive correlation with the PDO for Alaskan salmon: “A remarkable characteristic of Alaskan salmon abundance over the past half-century has been the large fluctuations at interdecadal time scales which resemble those of the PDO. …Time series for Washington-Oregon-California (WOC) coho and Columbia River spring chinook landings tend to be out of phase with the PDO index. … Recent work suggests that the marine ecological response to the PDO-related environmental changes starts with phytoplankton and zooplankton at the base of the food chain and works its way up to top level predators like salmon” [http://www.atmos.washington.edu/~mantua/REPORTS/PDO/pdo_paper.html]
See www.appinsys.com/GlobalWarming/PDO.htm for more information on the PDO.
|
|
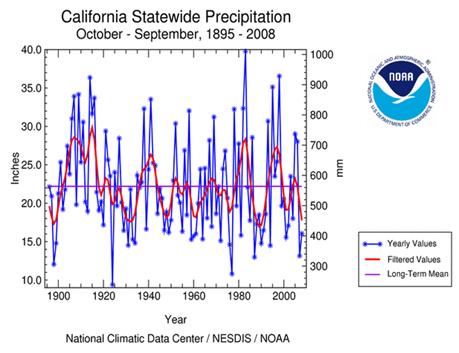
Precipitation
The following figure shows California statewide precipitation [http://www.ncdc.noaa.gov/img/climate/research/2008/ann/Reg004Dv00Elem01_10092008_pg.gif]
|
|
See also:
Regional Summary for Washington: www.appinsys.com/GlobalWarming/RS_Washington_usa.htm Regional Summary for California: www.appinsys.com/GlobalWarming/RS_California.htm
|
|
|


