Global Warming Science - www.appinsys.com/GlobalWarming
South Carolina, USA
[last update: 2010/01/20]
|
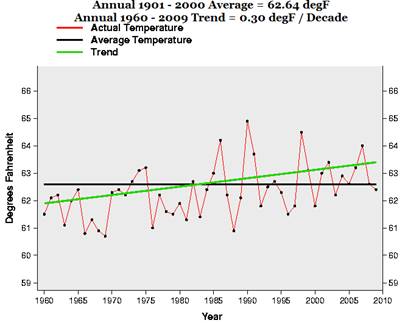
Alarm! Alarm! South Carolina has warmed 1.5 degrees over the last 50 years! Global warming is going to roast us alive!
|
|
Temperatures In Perspective
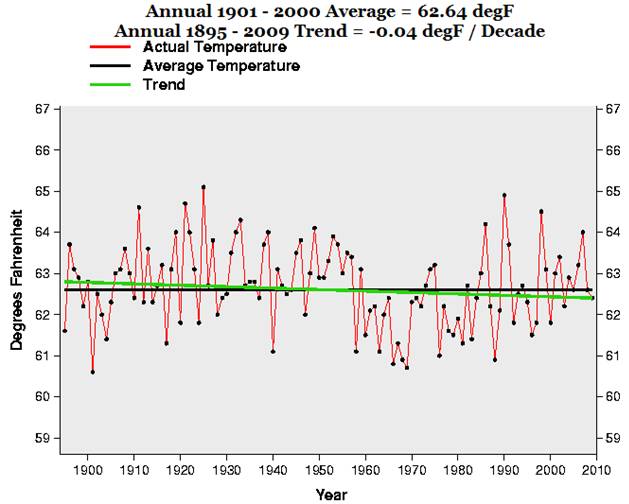
The above figure shows the typical global warming alarmist position. The following figure shows the position of one who puts data into perspective (i.e. the same data – without “cherry-picking” the start year). The warmest year was 1924.
The following figure shows the annual average temperature for South Carolina from the NCDC database [http://www.ncdc.noaa.gov/oa/climate/research/cag3/sc.html] No warming in the long-term data.
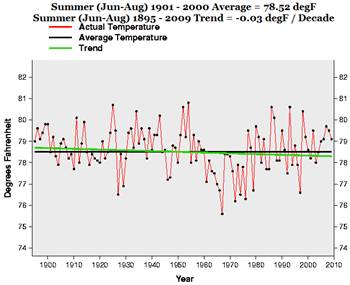
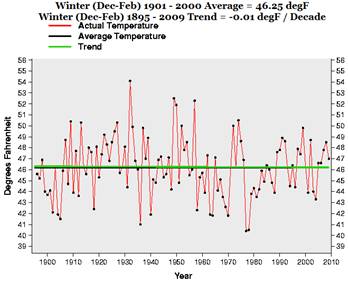
The following figures show summer (left) and winter (right) averages.
|
|
CRU Temperature Data
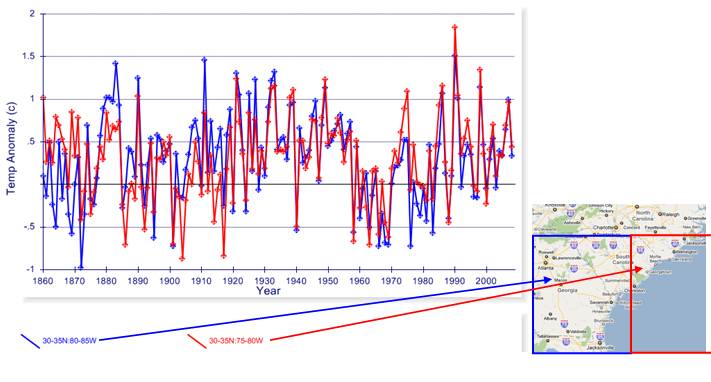
The Climatic Research Unit (CRU) at the University of East Anglia provides data to the IPCC. It is processed to 5x5 degree grids in terms of temperature anomalies with the zero-point as the 1961-1990 average.
The following figure shows the average annual temperature anomalies for the 2 grids covering most of South Carolina from the CRUTEM3 database (although these grids include part of Georgia, Florida and North Carolina). The warmest year was 1990. No warming in the long-term data.
|
|
|
|
Plot the data: http://www.appinsys.com/GlobalWarming/climate.aspx
|