This is part of the Regional Summary series at www.appinsys.com/GlobalWarming
Malawi, Africa
[last update: 2009/06/01]
According to the New York Times in an article called “Reports From Four Fronts in the War on Warming” (3 April 2007) “the first world owes the third world a climate debt”… “Malawi, which has a population of 14 million people and is one of the world’s poorest countries, identified $23 million worth of urgent measures it should take in the next three years. It delivered them to the United Nations program that helps poor nations deal with climate change.”
[http://www.nytimes.com/2007/04/03/science/earth/03clim.html?ex=1189137600&en=e105b3f30420b981&ei=5070]. The article implies that Malawi is a country that needs to be paid by the United States for this climate debt ““We cannot even know the duration of sunshine in our country for four years, so how can we measure climate change?” said Mr. Chilenga, a meteorological engineer. “Oh, oh, it is pathetic!” The lack of meteorological data is just one challenge as Malawi struggles to cope with global warming”.
But therein lays the real problem with the whole political warming scenario – the lack of supporting data.
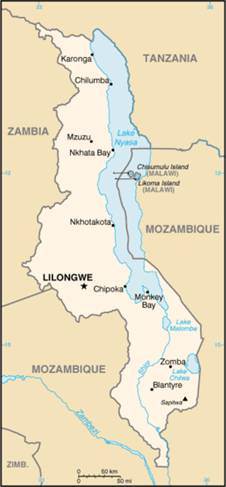
Malawi
|
From CIA FactBook |
[Wikipedia]: Malawi's climate is subtropical. A rainy season runs from November through April. There is little to no rainfall throughout most of the country from May to October. It is hot and humid from October to April along the lake and in the Lower Shire Valley. Lilongwe is also hot and humid during these months, a little less than in the south. The rest of the country is warm during those months. From June through August, the lake areas and far south are comfortably warm, but the rest of Malawi can be chilly at night, with temperatures ranging from 5 °–14 °C (41°–57°F).
Malawi has a GDP per capita of 596 US dollars. It is a landlocked, densely populated country. Its economy is heavily dependent on agriculture. Malawi has few exploitable mineral resources. Its three most important export crops are (in order) tobacco, tea and sugar. Traditionally Malawi has been self-sufficient in its staple food, maize, and during the 1980s exported substantial quantities to its drought-stricken neighbors. Agriculture represents 38.6% of the GDP, accounts for over 80% of the labor force, and represents about 80% of all exports. Nearly 90% of the population engages in subsistence farming.
[CIA FactBook]: The economy is predominately agricultural, with about 85% of the population living in rural areas. Agriculture accounts for about one-third of GDP and four-fifths of export revenues . [Intl Institute for Environment and Development]: Malawi has one of the highest population densities in Africa with five people to the hectare of arable land. Most Malawian families have six to seven children. 90% of the population depends on wood fuel as a source of energy.
|
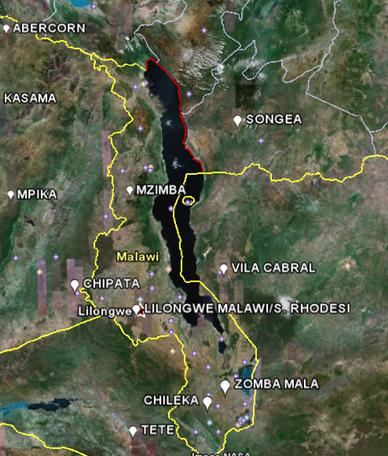
The following figure shows the temperature stations in the NASA / GISS database. There are no long-term continuous temperature stations in Malawi. (Chipata and Tete are also shown even though they are not in Malawi – they are in the same vicinity).

![]()

![]()
The New York Times climate alarmist article cited above does not hold up under scrutiny. Malawi had food shortage problems in 2005 and crop surpluses in 2006 and 2007. For example:
Afrol News reports (11 July 2007) [http://www.afrol.com/articles/26071]: “Malawi requires around two million mt of maize annually to feed its 12 million people. In 2006 it had a surplus of about 500,000mt and this year there is a surplus of about 1.5 million mt. The high yield has been attributed to a fertiliser subsidy programme and good rainfall. This year's maize crop has seen a 22 percent increase over last year's: 73 percent higher than the average for the past five years, according to government estimates.”
Reuters reports (28 July 2007) [http://www.alertnet.org/thenews/newsdesk/FEWS/140a8e3edfa67a095157aea07b026eb4.htm] “overall maize production at 3.44 million MT, 33.7 percent higher than the 2006 harvest. This is an historic record, and is attributed to favorable weather conditions”.
Maize production is not simply based on weather. According to the Carter Center [http://www.cartercenter.org/countries/malawi.html] “Maize accounts for half of the national cropping area in Malawi, the largest per capita producer of maize in the world. However, unstable market conditions already have driven large-scale… farmers, who previously accounted for 25 percent of maize production, to end maize cultivation in the nation altogether. in 2003, local currency devaluation was a major problem for farmers. As a result, there was an increase in the cost of fertilizers in 2004. These circumstances later led to maize scarcity in Malawi. Many farmers were storing their harvest in their local granaries, expecting to get better prices, only to find that concerned international nongovernmental organizations were distributing their own reserves of maize. Thus, farmers who tried to sell maize found it was surplus to market needs, and prices dropped dramatically. At the end of the day, the farmers were the losers, with many not prepared to invest in the necessary seeds and fertilizers for the next farming season.”
Scientific studies also do not support the anthropogenic global warming scenario for Malawi. An example:
“Recent effects of climate forcing on Lake Malawi surface temperatures: A possible shift in tropical climate response” by L.A. Powers, T.C. Johnson, J.P. Werne, I.S. Castañeda, E.C. Hopmans, J.S. Sinninghe Damsté and S. Schouten (Large Lakes Observatory, University of Minnesota, and Royal Netherlands Institute for Sea Research) [http://www.holivar2006.org/abstracts/viewabstract.php?id=101] states that the “temperature record illustrates a strong coherence with increasing CO2 levels and an anti-phase relationship with solar insolation through much of the record with the exception of the past 150 years when the records are in phase. Tropical solar radiative forcing, Lake Malawi temperature, and atmospheric CO2 have all risen rapidly since ~1900, when CO2 levels increased beyond the range of Holocene variability. The rise in Lake Malawi surface temperature over the past 150 years may signal a change in tropical climatic response to rapid increases in CO2. Although these increases are concurrent with the increase in solar radiative forcing at this point there is no evidence for a causal relationship.”
The IPCC calculates average temperatures based on the average temperatures in 5x5 degree grid “squares”. The IPCC AR4 (Figure 9.6, 2007) shows the following trend maps. The following temperature charts are from the GHCN database.
![]()
![]()
Left: 1901 – 2005 Right: 1979 – 2005
The following two figures are from the State of Environment Report for Malawi 1998 by the Empowerment for African Sustainable Development [http://easd.org.za/store/Docs/Malawi_SOE_1998.pdf]. The left-hand figure shows lake levels for Lake Malawi from 1885 to 1995. The right-hand figure shows the amount of deforestation that took place between 1972 and 1992. In those 20 years, Malawi’s forest area was reduced by more than 50 percent. This is of great importance given that deforestation accounts for 25 to 30 percent of the release of greenhouse gases worldwide according to the United Nations Food and Agriculture Organization (FAO) report in 2006 [http://www.fao.org/newsroom/en/news/2006/1000385/index.html]. The report states: “Most people assume that global warming is caused by burning oil and gas. But in fact between 25 and 30 percent of the greenhouse gases released into the atmosphere each year – 1.6 billion tonnes – is caused by deforestation.”
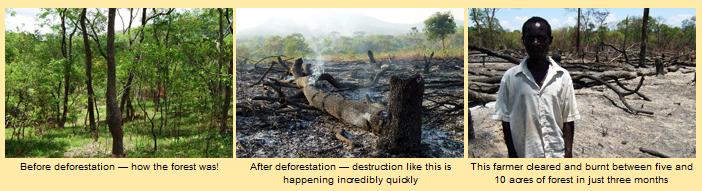
The following figure is from [http://www.rippleafrica.org/ripple_funding_trees_update2007.htm], which states: “Deforestation in Malawi, Africa, is a major problem, and 30% of the forests have disappeared in the last 10 years. Deforestation is happening very quickly on a frightening scale, and there is tremendous pressure on the natural resources because of the burgeoning population.”
The following figure shows long-term temperature reconstruction from Lake Malawi sediments from “Holocene Climate in Tropical Africa – Recent Results” by T. C Johnson (Large Lakes Observatory, University of Minnesota) [http://www.mesh.usc.edu/files/HPIM_Research_Summaries.pdf]. Temperatures have declined by 3 degrees over the last 5 thousand years (indicated in circled part of graph).

Malawi is susceptible to wide variations in rainfall. The following figure shows precipitation anomalies from 1960 to 1996 (from EASD referenced above).
The UN Food and Agriculture Organization (FAO) reported in March 2007 [http://www.fao.org/giews/english/shortnews/SouthernAfrica070319.htm] that “In Malawi, the first round of crop estimates has been completed and a maize harvest of 3.15 million tonnes is expected, an increase of 27 percent above last year’s bumper crop of 2.47 million tonnes. The rice crop is also good and a harvest of 107 797 tonnes is expected, an increase of 17 percent. Rainfall has been above normal and generally well distributed, in contrast to neighbouring countries in the region”.
The following figure shows Malawi total exports from 1964 to 2006 (in 000’s of Kwacha). (Data from the National Statistical Office of Malawi [http://www.nso.malawi.net/]. Since 80 percent of Malawi’s exports are agricultural it appears that the current warming trend is having a positive impact.