Global Warming Science - www.appinsys.com/GlobalWarming
The Arctic
[last update: 2009/10/11]
|
This is one of the longest regional summaries on this web site – with good reason – global warming is not global, it is mainly a northern hemisphere phenomenon (see http://www.appinsys.com/GlobalWarming/GW_NotGlobal.htm). And the Arctic is the area where the warming is greatest. Therefore this regional summary looks at the area in some detail.
This document contains information on the Arctic including:
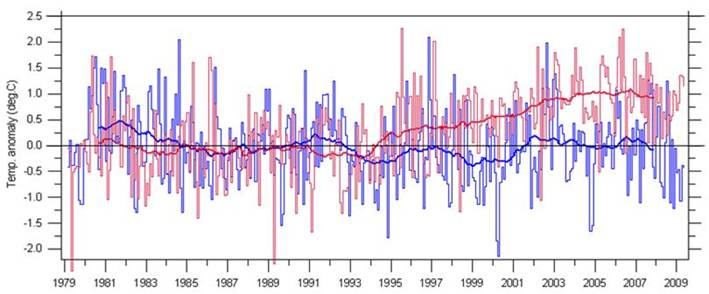
The following figure shows average Arctic temperature from the available satellite data (red) in comparison with the Antarctic (blue) [adapted from http://climate4you.com/]. Arctic – warming; Antarctic – not.
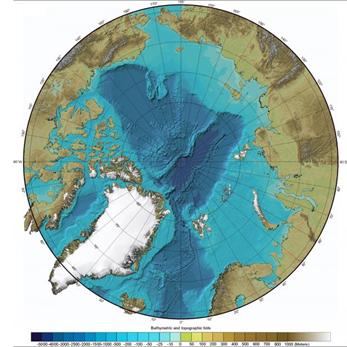
There are two main ocean water gateways of inflow to the Arctic – the Atlantic via Fram Strait and the Pacific via the Bering Strait. Normally the main inflow and outflow is via the Fram Strait with the Bering Strait being secondary. In recent years increased summer flows via the Bering Strait have had a major impact on Arctic sea ice.
|
||||
|
A European study “Meteorological trends (1991-2004) at Arctic Station, Central West Greenland (69º15’N) in a 130 years Perspective” (B.U. Hansen, B. Elberling and N. Nielsen: Institute of Geography, University of Copenhagen, and O. Humlum: Department of Physical Geography, Institute of Geosciences, University of Oslo, Norway) reported [http://www.rdgs.dk/image/pub_pdf/artikler/2006_1/GT106_04_Hansen_Elberling_Humlum_Nielsen.pdf]: “It is concluded that climate changes the last decade are dramatic but that similar changes in air temperatures have occurred previous within the last 130 years. … Over this long time period, estimated winter temperatures correlate significantly with NAO and reveal that although the documented climate changes the last decade are dramatic, they are on the same order as changes occurred between 1920 and 1930.”
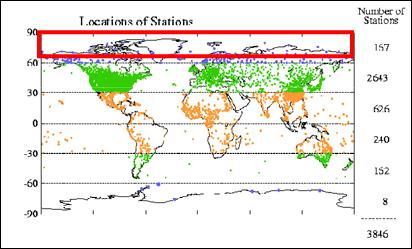
There are very few temperature stations in the Arctic.
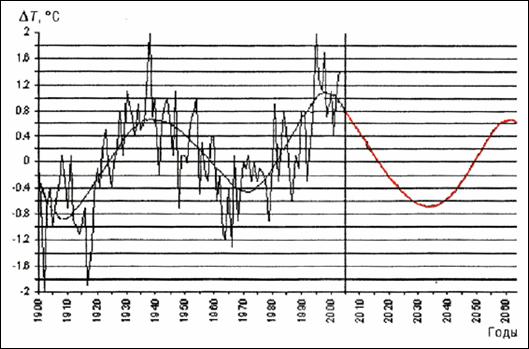
The following figure compares arctic temperature changes with the global average along with increased burning of CO2-releasing fossil fuels. This is from a report by the University of Alaska’s Akasofu [http://www.iarc.uaf.edu/highlights/2007/akasofu_3_07/earth_recovering_from_lia_r.pdf]: “the large fluctuation between 1920 and 1975 can be considered to be a natural change … unless the difference between the two changes can be understood, it is not possible to say tacitly that the rise after 1975 is mostly caused by the greenhouse effect. There is nothing wrong to suspect that the rise after 1975 contains a significant natural component.”
The following figures examine historical temperature data from two sources: the Hadley Climatic Research Unit (HadCRU) gridded data and the NOAA Global Historical Climate Network (GHCN) station data. The NOAA GHCN database provides data for individual stations throughout the world. The HadCRU gridded data has adjusted station data and calculated averages for 5x5 degree grids. (See www.appinsys.com/GlobalWarming/GW_Part2_GlobalTempMeasure.htm for more details on these data sources).
The following graphs show the data for 75 – 90 degrees N latitude (1930 – 2007). Left: average of all available HadCRU grids (14 grids), Right: average of all GHCN stations with data extending after 2000 (7 stations). The two data sets are similar showing for the high Arctic that recent temperatures are becoming similar to the 1930s.
The following graphs show the data for 65 – 75 degrees N latitude (1930 – 2007). Left: average of all available HadCRU grids (58 grids), Right: average of all GHCN stations with data extending after 2000 (39 stations). Again the data sets are fairly similar, although temperatures in this latitude band have exceeded the 1930s in the last few years.
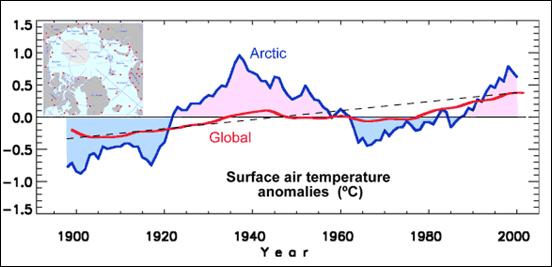
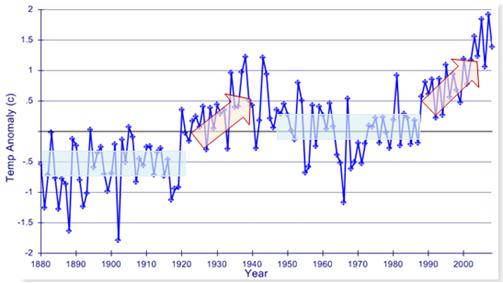
The following figure compares the Arctic temperature trends with global temperature trends. The Arctic temperatures are correlated with sea temperatures. [http://www.frontier.iarc.uaf.edu/~igor/research/aw/index.php] Two observations are evident from this graph: the recent Arctic warming is not unprecedented and the long-term overall temperature increase started before the increase in anthropogenic CO2.
Comparison of Arctic Temperatures with Global Temperatures
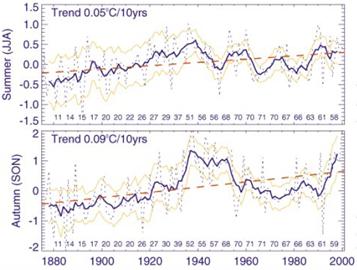
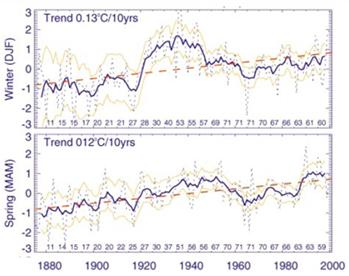
The following figure shows seasonal temperature trends for the Arctic (from “Variability and Trends of Air Temperature and Pressure in the Maritime Arctic, 1875 – 2000”, Polyakov et al, American Meteorological Society Journal of Climate, 2002 [http://www.frontier.iarc.uaf.edu:8080/~igor/research/warm/warm_apr02.pdf]). That paper stated: “We speculate that warming alone cannot explain the retreat of Arctic ice observed in the 1980s–90s. Also crucial to this rapid ice reduction was the low-frequency shift in the atmospheric pressure pattern from anticyclonic to cyclonic. Positive and negative LFO phases of the SAT are shifted by 5–15 yr relative to those in the SLP record. The complicated nature of Arctic temperature and pressure variations makes understanding of possible causes of the variability, and evaluation of the anthropogenic warming effect most difficult.” One thing that can be observed from the temperature data: the long-term warming trend started long before the major increase in anthropogenic CO2.
Seasonal Surface Air Temperature Anomalies for the Arctic (Blue dashed lines show annual means, blue solid lines 6-yr running means, yellow lines show the 95% confidence intervals.)
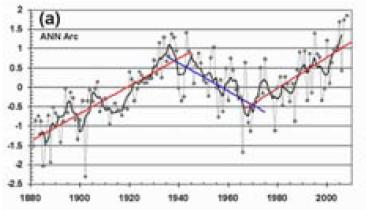
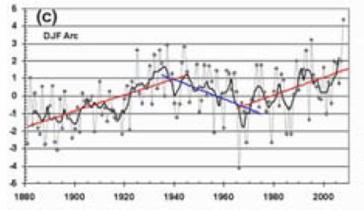
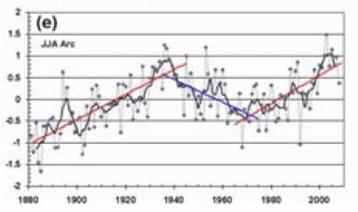
The following figures show Arctic temperature anomalies: (a) annual average, (c) winter average, (e) summer average (from: Chylek et al: “Arctic air temperature change amplification and the Atlantic Multidecadal Oscillation”, Geophysical Research Letters, Vol.36, 2009 [http://www.lanl.gov/source/orgs/ees/ees14/pdfs/09Chlylek.pdf]
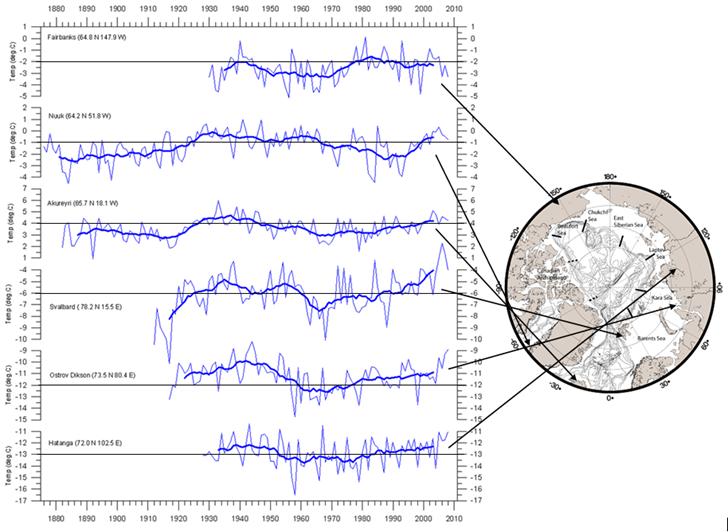
The following figure shows available long-term Arctic temperatures from the GISS database [http://www.climate4you.com/Polar%20temperatures.htm]. For most locations, when data are available back to the 1930s it is clear that the recent warming was not unprecedented.
The following figure shows average temperature trends in various “polar bear regions” of the Arctic. Somehow the polar bears managed to survive the 1930s.
A 2005 study of the effects of solar irradiance on Arctic temperatures (Soon, W.H., "Variable Solar Irradiance as a Plausible Agent for Multidecadal Variations in the Arctic-wide Surface Air Temperature Record of the Past 130 Years," Geophysical Research Letters, Vol. 32, 2005 [http://www.agu.org/pubs/crossref/2005/2005GL023429.shtml] showed that there is a much stronger correlation between temperatures and solar irradiance than with CO2, as shown in the following figures.
An article published in 2007 (I.E.Frolov et al. Scientific Research in Arctic. Vol. 2. “Climatic changes in the ice cover of the Eurasian shelf seas”, 2007 Arctic and Antarctic Research Institute (AARI) – St. Petersburg, Russia [http://icecap.us/images/uploads/AARI_PREDICTS_ARCTIC_COOLING.pdf]), shows the following figure showing the annual mean surface air temperature for 70N-90N and its predicted trend.
The following graph shows the average temperature anomaly for the Arctic from the Hadley CRUTEM3 database (www.cru.uea.ac.uk/cru/data/temperature/). This graph is the average of all 5x5 degree cells north of 60 degrees N, having data starting prior to 1930 (74 grids). Overlain shapes indicate periods of relative stasis (blue rectangles) and warming (red arrows). Warming cycles started in 1920 and 1988. (Graph from HadCRU data at the AppInSys climate data visualizer.)
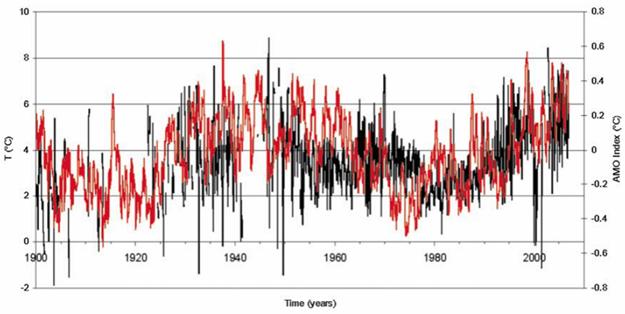
The following figure superimposes the Arctic average annual temperature shown above on the Atlantic Multidecadal Oscillation (AMO).
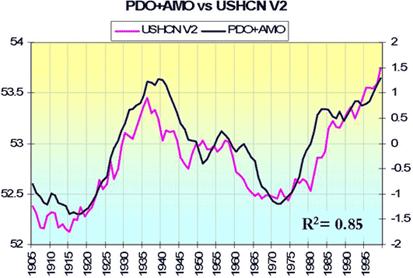
The following figure shows the sum of the AMO plus the Pacific Decadal Oscillation (PDO) [http://intellicast.com/Community/Content.aspx?a=127] (black line).
The following figure shows the AMO+PDO (black line above changed to red below) superimposed on the Arctic average annual temperature shown at the beginning of this document.
The above figures show the clear correlation of the Arctic temperature cycles to the oceanic oscillations – no CO2 connection.
|
||||
|
In June 2008, a National Geographic article “North Pole May Be Ice-Free for First Time This Summer” [http://news.nationalgeographic.com/news/2008/06/080620-north-pole.html] reported: “"We're actually projecting this year that the North Pole may be free of ice for the first time [in history]," David Barber, of the University of Manitoba, told National Geographic News aboard the C.C.G.S. Amundsen, a Canadian research icebreaker. … the immediate area around the geographic North Pole is now mostly annual, or first-year, ice—thin new ice that forms each year during the winter freeze … Almost all models have the Arctic completely ice free in the summer by 2100.” [September update – they got it wrong.]
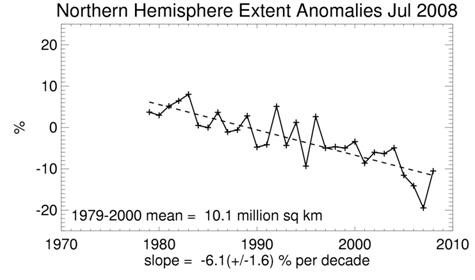
Arctic sea ice has indeed been declining in summer in recent decades as shown in the following figure showing annual July sea ice extent anomalies.
Arctic July Sea Ice Extent 1979 -2008 [http://nsidc.org/data/seaice_index/]
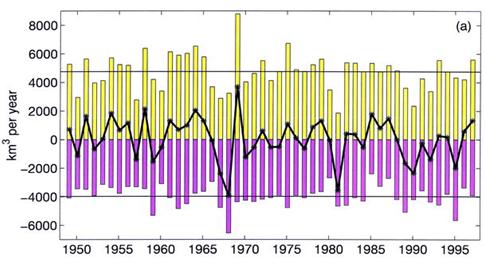
A paper in the Journal of Climate “Mechanisms Determining the Variability of Arctic Sea Ice Conditions and Export” (Cornelia Köberle and Rüdiger Gerdes - Alfred-Wegener-Institut für Polar- und Meeresforschung, Bremerhaven, Germany) [http://ams.allenpress.com/perlserv/?request=get-document&doi=10.1175%2F1520-0442(2003)016%3C2843%3AMDTVOA%3E2.0.CO%3B2] concludes: “the wind forcing significantly contributes to the decadal variability in the Arctic ice volume, affecting both thermodynamic growth (by opening and closing of areas of open water due to divergent sea ice transport and ridging) and the ice export rate. … These results make connecting “global warming” to Arctic ice thinning very difficult for two reasons. First, large decadal and longer-term variability masks any trend. Restricted time series that are available from observations (limited by the availability of submarine observations after 1958) and model results (limited by the available forcing data) produce trends that are more or less arbitrary. … the wind stress strongly affects the long-term development of ice volume.”
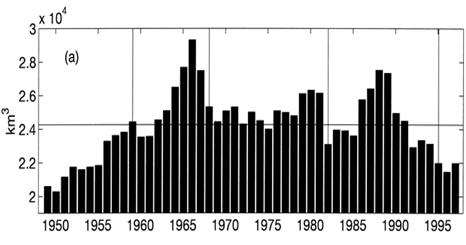
The following figures are from the above paper. Top: Arctic annual ice volume change (summer ice export in magenta, winter ice growth in yellow, black line - annual rate of change. Bottom: arctic ice volume 1950 - 1997. As can be seen, the recent decrease in ice volumes is not unprecedented.
Arctic annual ice volume change
Annual Arctic Ice Volume (Aug to following July) – Horizontal Line = 50-year Average
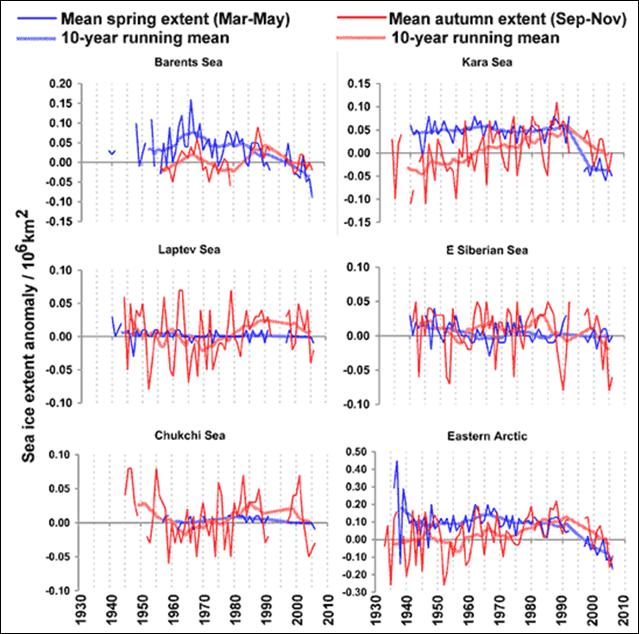
The following figure shows spring and fall sea ice extent for seas adjacent to Russia [http://nsidc.org/research/projects/Barry_Eurasian_Arctic.html]. For many of the areas, recent sea ice decreases are not unprecedented when the historical data of the 1930s is included.
A study published in 2009 (Wang, Zhang, Watanabe, Ikeda, Mizobata, Walsh, Bai and Wu: “Is the Dipole Anomaly a major driver to record lows in Arctic summer sea ice extent?”, Geophysical Research Letters, Vol 36, 2009 [ftp://ftp.glerl.noaa.gov/wang/Related_Papers/Wang_paper63_2009_GRL.pdf]) states: “Since 2002, when summer Arctic sea ice continued to set one record low after another, the AO [Arctic Oscillation] index has become mostly neutral or even negative [Maslanik et al., 2007], suggesting a weak link between the AO and the rapid sea ice retreat in the recent years. Thus, there must be a new explanation for the record low sea ice since 1995. Such an explanation will help understand the internal variability of Arctic climate and sea ice. … Recent record lows of Arctic summer sea ice extent are found to be triggered by the Arctic atmospheric Dipole Anomaly (DA) pattern. This local, second–leading mode of sea–level pressure (SLP) anomaly in the Arctic produced a strong meridional wind anomaly that drove more sea ice out of the Arctic Ocean from the western to the eastern Arctic into the northern Atlantic during the summers of 1995, 1999, 2002, 2005, and 2007. In the 2007 summer, the DA also enhanced anomalous oceanic heat flux into the Arctic Ocean via Bering Strait, which accelerated bottom and lateral melting of sea ice and amplified the ice–albedo feedback.”
A 2004 study (Wu and Walsh: “Dipole Anomaly in the Winter Arctic Atmosphere and Its Association with Sea Ice Motion”, Journal of Climate, 2006 [http://ams.allenpress.com/perlserv/?request=get-abstract&doi=10.1175%2FJCLI3619.1] states: “When the dipole anomaly remains in its positive phase, that is, negative SLP anomalies appear between the Kara Sea and the Laptev Sea with concurrent positive SLP over from the Canadian Archipelago extending southeastward to Greenland, there are large-scale changes in the intensity and character of sea ice transport in the Arctic basin. The significant changes include a weakening of the Beaufort gyre, an increase in sea ice export out of the Arctic basin through Fram Strait and the northern Barents Sea, and enhanced sea ice import from the Laptev Sea and the East Siberian Sea into the Arctic basin.”
From the Arctic Report Card 2008 [http://www.arctic.noaa.gov/reportcard/ocean.html]: “The circulation of the sea ice cover and ocean surface layer are closely coupled and are primarily wind-driven. Data from satellites and drifting buoys indicate that the entire period of 2000–2006 has been characterized by an anticyclonic (clockwise) circulation regime due to a higher sea level atmospheric pressure over the region north of Alaska, relative to the 1948–2005 mean, and the prevalence of anticyclonic winds. Under these conditions, the clockwise circulation pattern in the Beaufort Sea region (the Beaufort Gyre) tends to be relatively strong. Conversely, in the cyclonic regime the clockwise circulation pattern in the Beaufort Sea region weakens, and the flow across the basin, from the Siberian and Russian coasts to Fram Strait (the Transpolar Drift), shifts poleward. The cyclonic pattern dominated during 1989–1996; the anticyclonic pattern has prevailed since 1997.”
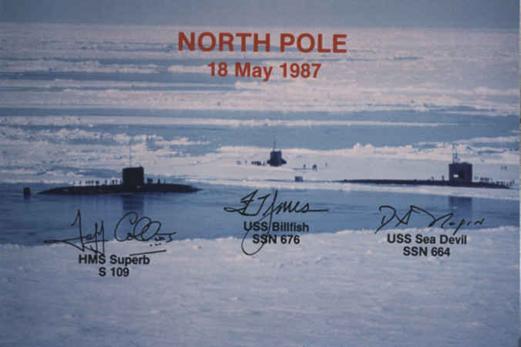
The U.S. Navy shows photos of a multi-national three-ship rendezvous at the North Pole in May 1987, showing it to have significant melted area [http://www.csp.navy.mil/]:
U.S. Navy photo: https://www.csds5.navy.mil/asl/ScrapBook/Boats/NorthPole1987.jpg
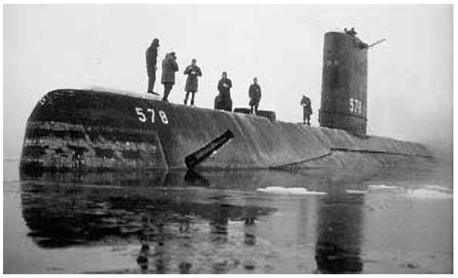
And in 1959 the U.S Navy submarine Skate (SSN-578), surfaced at the North Pole (17 March 1959):
U.S. Navy photo http://www.navsource.org/archives/08/0857806.jpg http://www.navsource.org/archives/08/08578.htm
The University of Illinois Polar Research Group provides sea ice comparisons for any date [http://igloo.atmos.uiuc.edu/cgi-bin/test/print.sh]. The image below compares the nearest available date to the above 1987 photo with the same date in 2008.
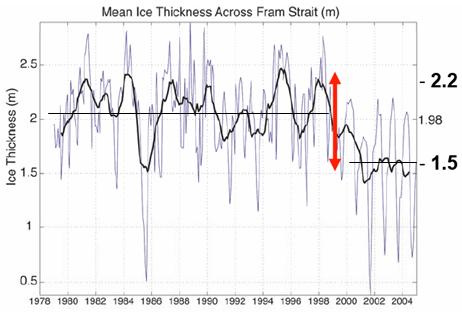
The following figure shows the mean ice thickness across Fram Strait [http://www.ees.hokudai.ac.jp/coe21/dc2008/DC/report/Maslowski.pdf]. There are large annual fluctuations, which changed to a new level after the 1998 – 2000 decline.
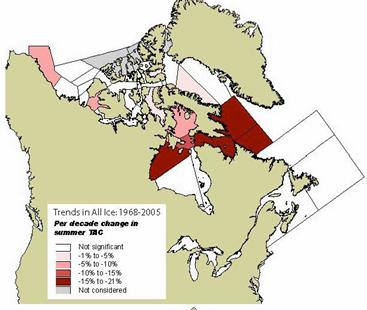
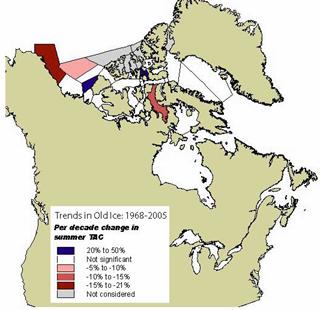
There is considerable variation in regional trends of Arctic sea ice reduction: [http://ice-glaces.ec.gc.ca/content_contenu/minArcticIce_2007.pdf] “Sea ice trend studies for the Canadian Arctic indicate that while some areas show significant negative trends, many areas do not yet display detectable trends.“ The following figures show summer ice trends in all ice (left) and old ice (right) for the Canadian Arctic.
The following figures show monthly sea ice extent for various regions of the Arctic (plots from: http://www.socc.ca/seaice/seaice_hist_e.cfm)
(Hudson Bay is not actually in the Arctic)
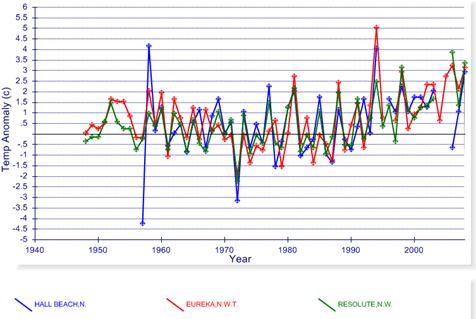
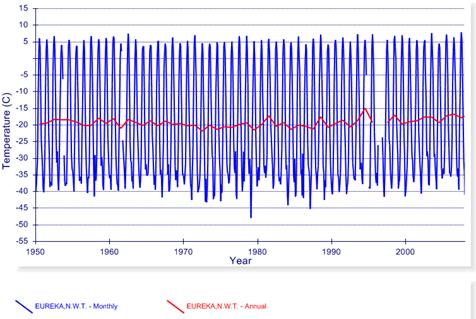
The following figures show: Top: the available temperature anomaly data for the 3 longest-term stations in the Canadian Archipelago region in the GHCN database. Data only exists since about 1950. All three stations have similar temperature trends. Right: monthly temperature data (blue) for one of the above stations (Eureka), as well as the annual average (red). The monthly temperature data shows that the summer temperature has fluctuated an insignificant amount compared with the winter temperature over the last 60 years.
In 2007 the Arctic sea ice reached a record low. The National Geographic article cited previously states: “Scientists say the record loss last year was due to a combination of warm ocean currents, fluke winds, and unusually sunny weather.” – i.e. not due to CO2-induced air temperatures.
NASA (Oct 2007) reported [http://www.nasa.gov/vision/earth/lookingatearth/quikscat-20071001.html]: “the rapid decline in winter perennial ice the past two years was caused by unusual winds. "Unusual atmospheric conditions set up wind patterns that compressed the sea ice, loaded it into the Transpolar Drift Stream and then sped its flow out of the Arctic," he said. When that sea ice reached lower latitudes, it rapidly melted in the warmer waters.”
Researchers at the University of Washington reported [http://www.sciencenews.org/articles/20071222/fob2.asp]: “In parts of the Arctic Ocean this year [2007], sea surface temperatures were 3.5°C warmer than average and a full 1.5°C warmer than previously recorded highs, says Michael Steele, also of the University of Washington in Seattle. All that warm water chewed away at Arctic ice from below. In some parts of the Beaufort Sea, north of Alaska and western Canada, ice that started the summer 3.3 m thick ended up measuring just 50 centimeters. About 70 cm of that shrinkage resulted from melting of the ice's upper surface—a typical amount for the summer, says Perovich. However, a whopping 2 m or so of that erosion, about five times the normal summer loss, occurred from below”.
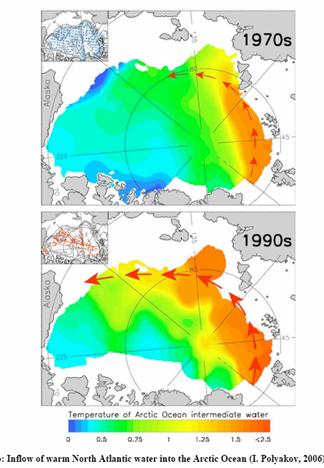
The following figures are from Polyakov, as displayed in a paper by Akasofu who states: “The recent rapid retreat of sea ice in the Arctic Ocean, particularly in 2007, is partly caused by the inflow of warm North Atlantic … and also the effects of winds and currents. … warm water was melting sea ice from the bottom until … Thin ice tends to break up easily by stormy water and is then easily forced to flow by winds and currents. This was exactly what happened in the fall of 2007.” [http://people.iarc.uaf.edu/~sakasofu/pdf/two_natural_components_recent_climate_change.pdf]
The figure below shows the increases in seawater temperature at two locations in the Arctic Ocean in the area north of eastern Russia.
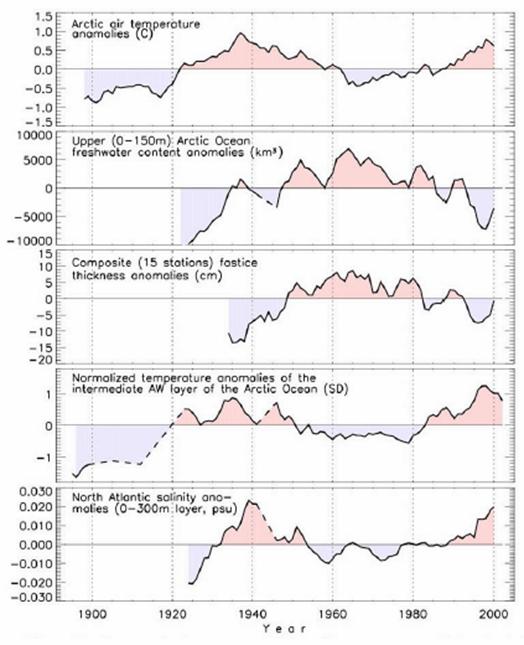
The figure below shows anomalies for Arctic air temperature, freshwater content, ice thickness, intermediate Arctic Ocean temperatures and North Atlantic salinity.
|
||||
|
Arctic Sea Surface Temperatures
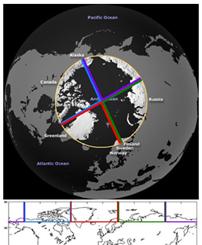
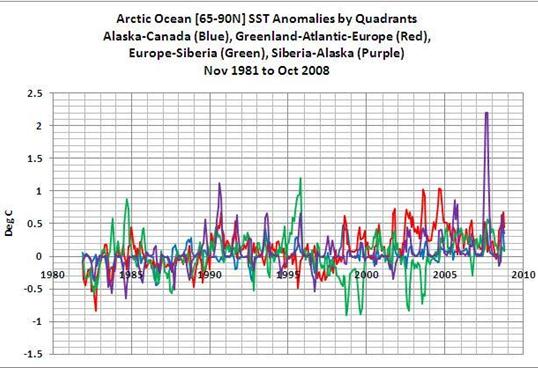
The following figure shows Arctic Ocean sea surface temperature anomalies for satellite data for 4 Arctic Ocean quadrants for 1982 to 2008. (Data from NOAA Satellite and Information Service [http://nomads.ncdc.noaa.gov/#climatencdc] plotted by Bob Tisdale [http://bobtisdale.blogspot.com/2008/11/2007-spike-in-arctic-ocean-sst.html] This shows that the 2007 temperature spike occurred in the area north of eastern Russia
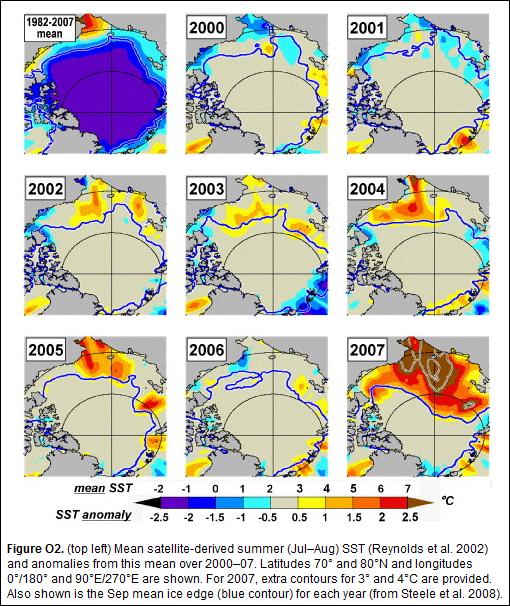
The following figure shows the summer sea surface temperature anomalies for 2000 - 2007 [http://www.arctic.noaa.gov/reportcard/ocean.html]. The temperature increase in the East Siberian Sea is very noticeable corresponding to the purple line in the graph above. The text from the article accompanying the figure below states: “Salinity trends in the Laptev Sea and East Siberian Sea indicate that ocean circulation plays a dominate role in these areas, where in recent years freshwater has been diverted eastward along the coast, rather than northward toward the deep ocean.”
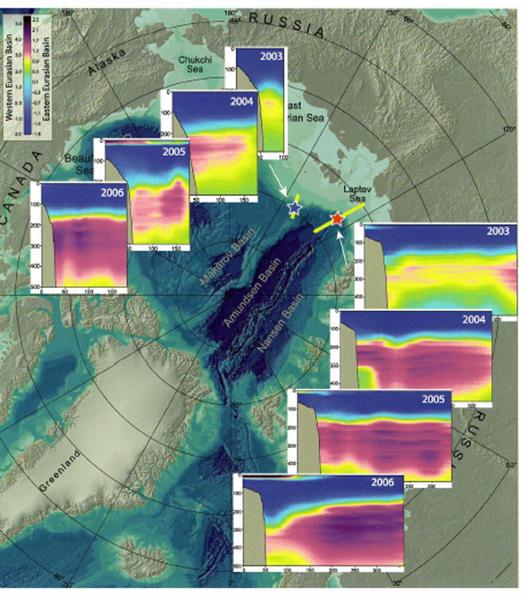
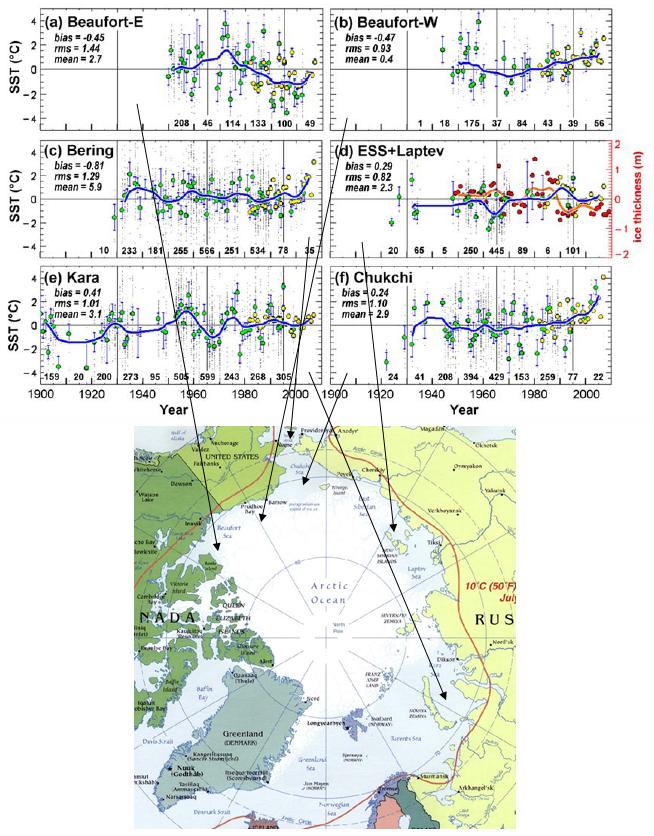
The following figure shows summer sea surface temperature anomalies for six Arctic shelf regions up to 2005. The Chukchi Sea shelf shows the largest recent increase in SST, with Bering close behind. This is the influx of warm water shown above in the 2004 /2005 frames. [http://psc.apl.washington.edu/zhang/Pubs/Steele_etal2007GL031651.pdf]
Following the 1998 extreme El Nino event, annual summer influxes of warm water from the Bering Sea to the Chukchi Sea started occurring and increasing in magnitude until 2007. The following figure shows the heat flux across the Chukchi Sea shelf line up to 2004 [www.arcus.org/ARCSS/downloads/SBI_eMtg_30Jan06.ppt]
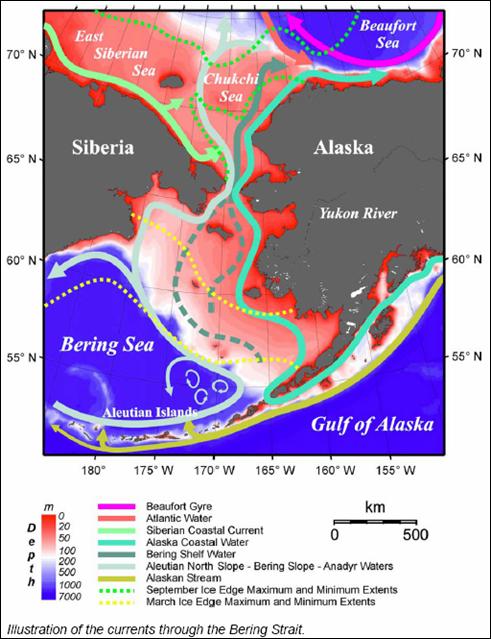
The following figure shows the currents from the Pacific through the Bering Strait into the Arctic Ocean [http://www.arctic.noaa.gov/aro/russian-american/2008/THE_PACIFIC_GATEWAY_TO_THE_ARCTIC.pdf]: “The Bering Strait, a narrow (~ 85 km wide), shallow (~ 50 m deep) strait at the northern end of the Pacific, is the only ocean gateway between the Pacific and the Arctic. Although the flow through the strait is small in volume (~ 0.8 Sv northward in the annual mean), due to its remarkable properties (high heat and freshwater content, low density, high nutrients) it has a startling strong influence, not only on the Chukchi Sea and the Arctic Ocean, but also on the North Atlantic overturning circulation and possibly world climate. … At the time when dramatic change, especially the retreat of sea-ice, is observed in the Bering and Chukchi seas and the Arctic, we have measured significant increases of Bering Strait fluxes of volume, freshwater and heat, the heat flux in 2004 being the maximum recorded in the last 15 years.”
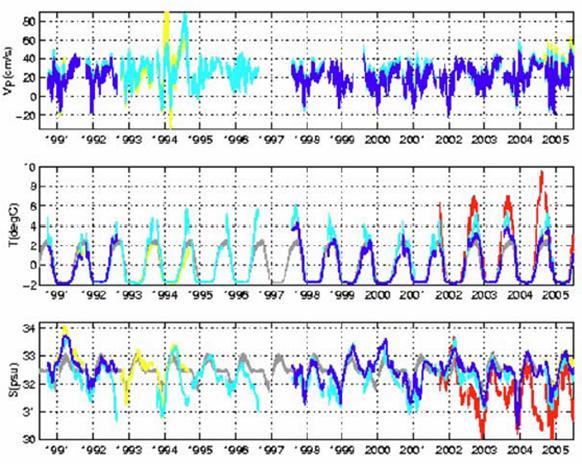
The following figure is from the same paper, showing velocity, temperature and salinity data for the Bering Strait from 1991 to 2005. The velocity and temperature have been increasing and salinity decreasing in recent years.
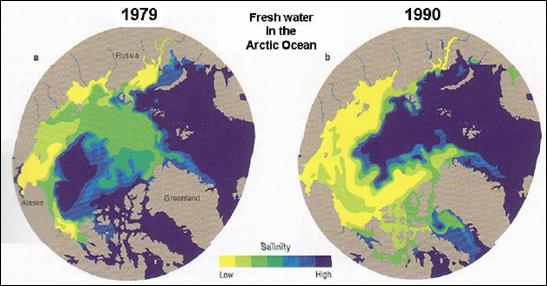
The following figure is from the same paper as above, showing decreasing salinity from 1979 to 1990 in the Arctic adjacent to the Bering Strait.
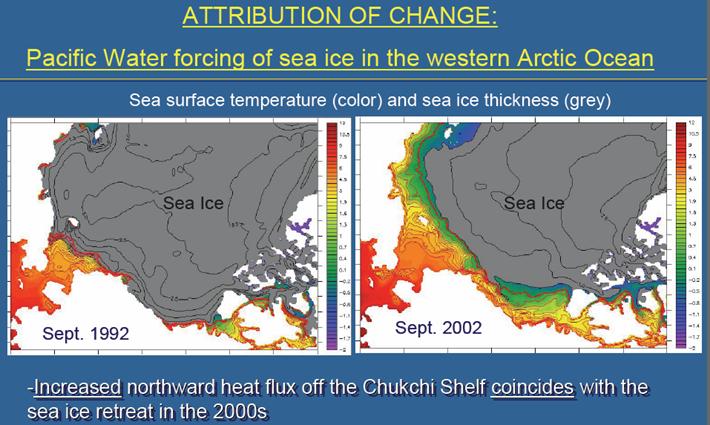
The following figure is from [http://www.ametsoc.org/atmospolicy/documents/May032006_Dr.WieslawMaslowski.pdf]
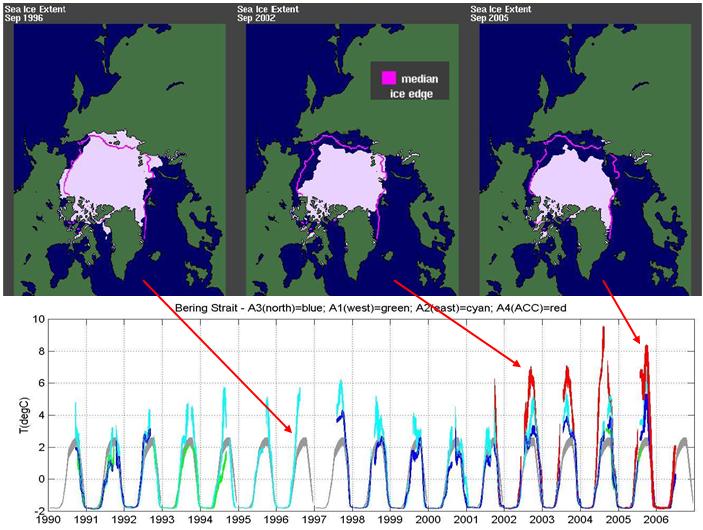
The following figure combines sea ice plots from [http://www.ametsoc.org/atmospolicy/documents/May032006_Dr.WieslawMaslowski.pdf] with a plot of Bering Strait temperature from [www.udel.edu/CATS/reports/OSU2006/RebeccaWoodgateBering.ppt] That report states in the conclusions: “The increased heat fluxes via Pacific/Atlantic Water explain the lack of correlation between sea ice and atmospheric forcing in the 2000s”.
A 2008 paper examining modeling of the Arctic [http://adsabs.harvard.edu/abs/2008AGUFM.C44A..06M] states: “General circulation models (GCMs) that participated in the Intergovernmental Panel for Climate Change Fourth Assessment Report (IPCC-AR4) on average predict some 50% or more reduction of summer sea ice cover in the Arctic Ocean by the end of this century. Unfortunately the majority of those models have significant limitations in their representation of past and present variability in the Arctic. The inability of climate models to reproduce the recent warming and ice melt in the Arctic Ocean diminishes their accuracy of future climate predictions. Some of these limitations include: northward oceanic heat fluxes, distribution and variability of sea ice in the Arctic Ocean, and its export into the North Atlantic. The general tendency in those models is to transport warm Atlantic Water via the Barents Sea, with Fram Strait experiencing mostly outflow to the south. In reality, the West Spitsbergen Current flowing along the eastern part of Fram Strait delivers the majority of heat into the Arctic Ocean, while most of the heat entering the Barents Sea is released to the atmosphere before entering the central Arctic. More importantly, the heat advected by Summer Pacific Water through Bering Strait is distributed by local currents and eddies over the Chukchi Shelf and into the Beaufort Sea and is readily available for melting sea ice in the western Arctic, where most of the ice retreat has taken place.”
NASA Earth Observatory (Dec 2007) reported [http://earthobservatory.nasa.gov/Newsroom/NasaNews/2007/2007121225985.html]: “Using data from CloudSat and NASA’s Cloud-Aerosol Lidar and Infrared Pathfinder Satellite Observation satellite, they found the total cloud cover over the western Arctic, where most of the ice loss occurred, was 16 percent less over the 2007 melt season than in 2006. The resulting clearer skies in 2007 heated the Arctic surface enough to warm ocean waters by 2.4 degrees Celsius (four degrees Fahrenheit) or enough to melt 0.3 meters (one foot) of sea ice.”
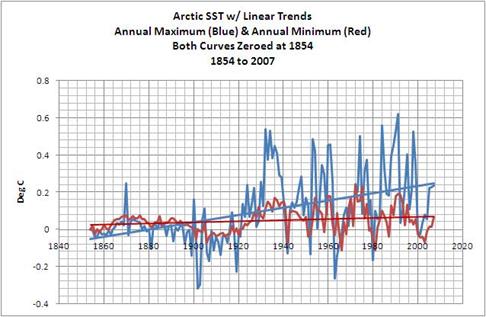
The following figure shows Arctic sea surface temperatures in terms of annual maximum temperature anomalies (blue) and annual minimum temperature anomalies (red) [http://bobtisdale.blogspot.com/2008/06/arctic-sst.html]. This shows the opposite trend from Eureka air temperatures (above) – summer ocean temperatures have increased and fluctuate significantly, while winter ocean temperatures have not increased significantly.
A recent study reported in Nature reports that the Arctic seabed is afire with lava-spewing volcanoes [http://www.canada.com/topics/news/story.html?id=81bb2fd3-63f1-476f-b0be-f48c0dc90304]: "Explosive volatile discharge has clearly been a widespread, and ongoing, process," according to an international team that sent unmanned probes to the strange fiery world beneath the Arctic ice. The $5-million expedition was financed by the U.S. National Science Foundation and NASA They returned with images and data showing that red-hot magma has been rising from deep inside the earth and blown the tops off dozens of submarine volcanoes, four kilometres below the ice. "Jets or fountains of material were probably blasted one, maybe even two, kilometres up into the water," says geophysicist Robert Sohn of the Woods Hole Oceanographic Institution, who led the expedition. "The scale and magnitude of the explosive activity that we're seeing here dwarfs anything we've seen on other mid-ocean ridges," says Sohn, who studies ridges around the world. The volume of gas and lava that appears to have blasted out of the Gakkel volcanoes is "much, much higher" than that seen at other ridges.”
The Gakkel Ridge is an underwater mountain chain extending 1,100 miles from the northern tip of Greenland to Siberia and is the northern extension of the Mid-Atlantic Ridge, which runs all the way down the middle of the Atlantic Ocean (see www.appinsys.com/GlobalWarming/RS_AntarcticPeninsula.htm to see where this ridge connects to Antarctica). These volcanic eruptions are deep below the ice and would not directly cause any melting of the Arctic sea ice.
A study published in 2009 (Levitus et al: “Barents Sea multidecadal variability”, Geophysical Research Letters, Vol.36, 2009) provides the following figure showing “Monthly temperature (C) in the Barents Sea for the 100–150 m layer, from 1900 to 2006. Years without all 12 months of data are not plotted. The red line is the Atlantic Multidecadal Oscillation Index” [http://www.leif.org/EOS/2009GL039847.pdf]. This shows a strong correspondence between Arctic – Barents Sea – sea temperatures and the AMO.
|
||||
|
An article in Science Daily: “Winds, Ice Motion Root Cause Of Decline In Sea Ice, Not Warmer Temperatures” [http://www.sciencedaily.com/releases/2004/12/041220010410.htm] states: “Extreme changes in the Arctic Oscillation in the early 1990s -- and not warmer temperatures of recent years -- are largely responsible for declines in how much sea ice covers the Arctic Ocean, with near record lows having been observed during the last three years, University of Washington researchers say. It may have happened more than a decade ago, but the sea ice appears to still "remember" those Arctic Oscillation conditions, according to Ignatius Rigor, a mathematician with the UW's Applied Physics Laboratory”
The National Snow and Ice Data Center states: “Over most of the past century, the Arctic Oscillation alternated between its positive and negative phases. Starting in the 1970s, however, the oscillation has tended to stay in the positive phase, causing lower than normal arctic air pressure and higher than normal temperatures in much of the United States and northern Eurasia.” [http://nsidc.org/arcticmet/patterns/arctic_oscillation.html]
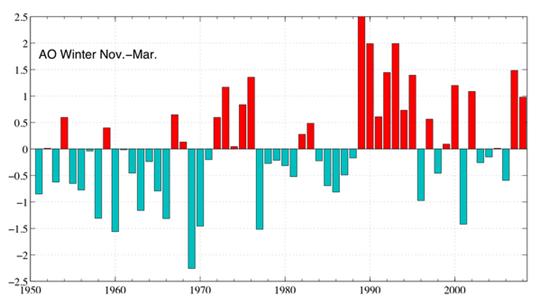
The following figure shows the winter Arctic Oscillation (AO) for 1950 - 2008 [http://www.arctic.noaa.gov/detect/climate-ao.shtml]
“The AO index describes the relative intensity of a semipermanent low-pressure center over the North Pole. A band of upper-level winds circulates around this center, forming a vortex. When the AO index is positive and the vortex intense, the winds tighten like a noose around the North Pole, locking cold air in place. A negative AO and weak vortex … allow intrusions of cold air to plunge southward into North America, Europe, and Asia. … the index has been mostly positive in wintertime since the late 1980s. The Arctic Oscillation has strengthened in recent decades, contributing to the unusual warmth over the Northern Hemisphere land masses.” [http://www.ucar.edu/communications/newsreleases/2003/deser.html]
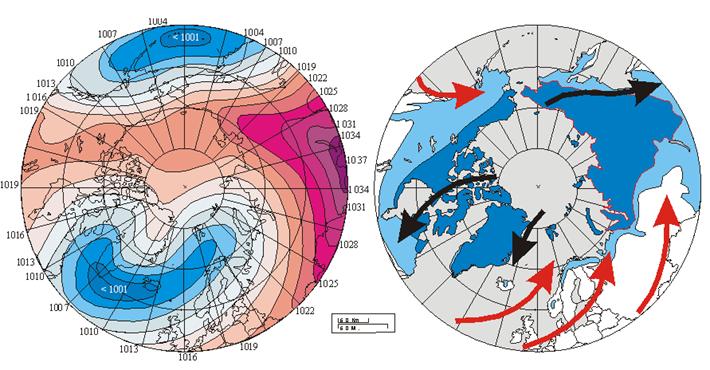
The following figures show: Left: winter (DJF) sea-level pressure (SLP) averaged over the period 1900-2001. The AO index refers to opposing atmospheric pressure patterns in northern middle and high latitudes. The blue areas are low pressure areas. Right: modern distribution of permafrost in the Northern Hemisphere. Continuous permafrost is shown by dark blue colour. Discontinuous and sporadic permafrost is shown by light blue color. Red and black arrows show main surface air flow (warm and cold, respectively) as generated by the 20th century pattern of SLP. The overall wind systems set up by the average winter sea-level pressure appears to represent one of several controls on the present distribution of permafrost in the northern hemisphere. [http://www.climate4you.com/NAOandAO.htm]
Further information on the Arctic Oscillation can be found at: http://jisao.washington.edu/wallace/ncar_notes/
|
||||
|
River Discharge to the Arctic Ocean
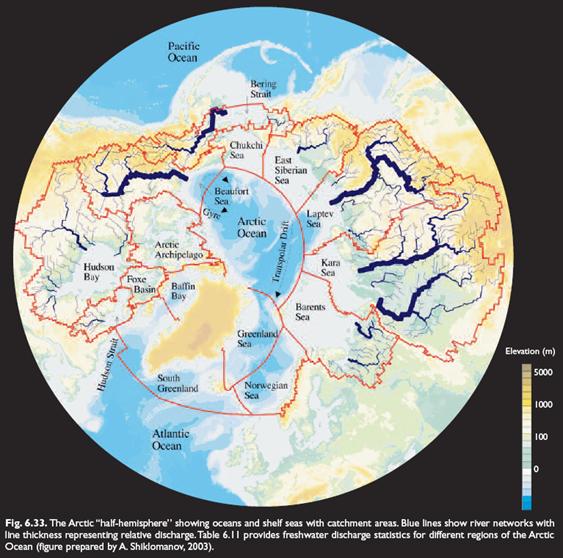
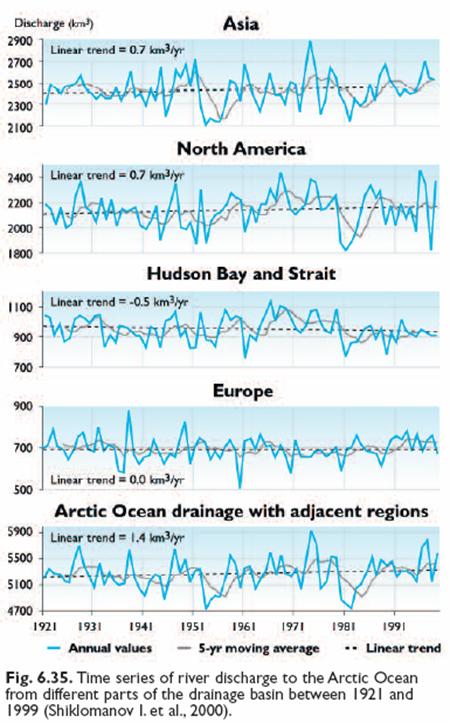
One of the reasons for increasing temperatures and increasing fresh water is the increased river discharge in to the Arctic Ocean. The following figure shows relative river inflow to the Arctic Ocean [http://www.acia.uaf.edu:16080/PDFs/ACIA_Science_Chapters_Final/ACIA_Ch06_Final.pdf].
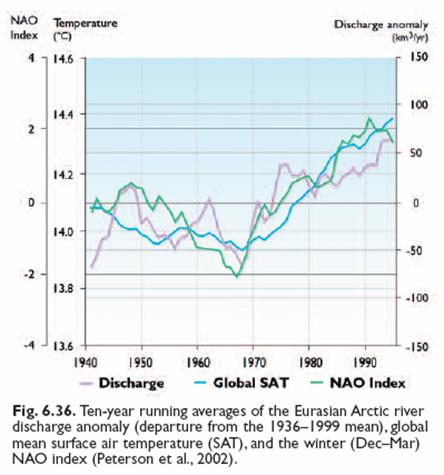
The following figures are from the same source cited above. The top figure shows the regional river discharge since the 1920s. The bottom figure shows the total river discharge compared to the North Atlantic Oscillation and global air temperature since 1940. “In addition to its correlation with regional temperature, discharge from the large Siberian rivers is correlated with global mean surface air temperature and with the NAO index (Peterson et al., 2002), as shown in Fig. 6.36.The linkage between the NAO (or its broader manifestation, the AO) and Eurasian temperature and precipitation has been documented by Thompson and Wallace (1998) and Dickson et al. (2000).The strengthened westerlies characteristic of the positive phase of the NAO enhance the transport of moisture and relative warmth across northern Europe and northern Asia (Semiletov et al., 2002). It is apparent from Fig. 6.36 that the NAO (or the AO) should be considered in diagnoses of variations in Eurasian river discharge over interannual to decadal timescales. … In a study that used long-term hydrometric observations for the Eurasian Arctic, Peterson et al. (2002) found that the annual discharge to the Arctic Ocean from the six largest Eurasian rivers increased by 7% between 1936 and 1999. Although the increase is not monotonic (Fig. 6.36), it is statistically significant. The 7% increase in the discharge of these rivers implies that the annual freshwater inflow to the Arctic Ocean is now 128 km3 greater than it was in the mid-1930s.“
|
||||
|
A 2007 paper by Syun-Ichi Akasofu at the International Arctic Research Center (University of Alaska Fairbanks) provides an analysis of warming trends in the Arctic. [http://www.iarc.uaf.edu/highlights/2007/akasofu_3_07/index.php ] The authors analyzed various climate-related trends in the Arctic, including the contraction of sea ice and glaciers (shown in the figure below): “Figure 8 shows that the southern edge of sea ice in the Norwegian Sea has been continuously receding from about 1800. Figure 9 shows examples of glaciers in Greenland and Alaska, which have been receding from the time of the earliest records (about 1800 for Greenland and 1900 for Alaska). There are a large number of similar records from the European Alps and elsewhere (Grove, 1982). Therefore, it can be assumed that many glaciers advanced during the Little Ice Age and have been receding since then. Thus, the retreat is not something that happened only in recent years.”
Sea Ice Retreat [from Akasofu]
They also analyzed the capability of climate models (GCMs) to reproduce the past temperature trends of the Arctic (shown in the following figure): “we asked the IPCC arctic group (consisting of 14 sub-groups headed by V. Kattsov) to “hindcast” geographic distribution of the temperature change during the last half of the last century. To “hindcast” means to ask whether a model can produce results that match the known observations of the past; if a model can do this, we can be much more confident that the model is reliable for predicting future conditions … Ideally, the pattern of change modeled by the GCMs should be identical or very similar to the pattern seen in the measured data. We assumed that the present GCMs would reproduce the observed pattern with at least reasonable fidelity. However, we found that there was no resemblance at all.”
Model vs Observed temperature Changes [from Akasofu]
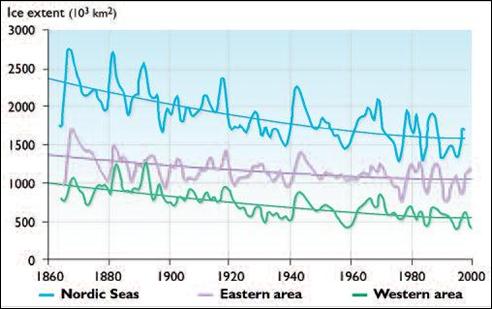
The following figure shows historic sea ice extent in the Nordic Seas (Vinje, T., 2001. “Anomalies and trends of sea ice extent and atmospheric circulation in the Nordic Seas during the period 1864–1998”. Journal of Climate, 14:255–267 [http://www.eoearth.org/article/Sea_ice_in_the_Arctic]). The general trend of decline in sea ice has a time frame much longer than anthropogenic CO2 – likely since the end of the little ice age.
Historical record of April sea-ice extent (two-year running means) in the Nordic Seas and eastern and western subregions
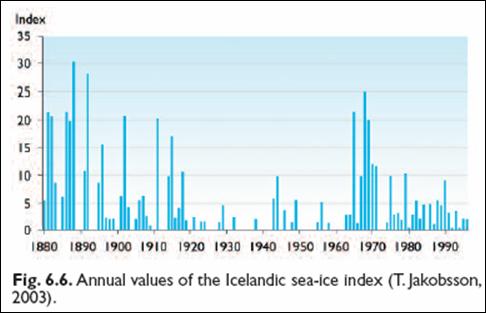
The following figure shows Icelandic sea ice since 1880 [http://www.acia.uaf.edu:16080/PDFs/ACIA_Science_Chapters_Final/ACIA_Ch06_Final.pdf]. The current reduction in sea ice is not unprecedented – it was lower in the 1930s – 1940s. The long term trend has been a decline since the 1800s – i.e. since before CO2 could impact the climate.
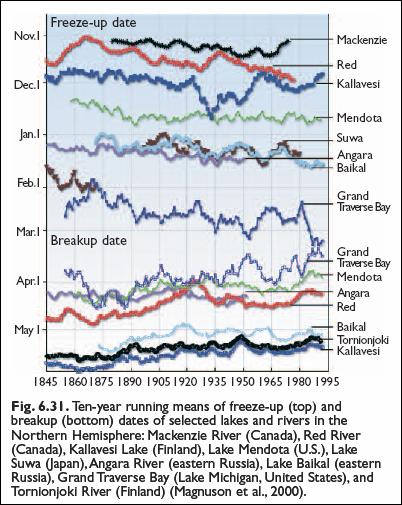
The following figure shows various rivers that flow into the Arctic Ocean in terms of their freeze-up and break-up dates since 1845 [http://www.acia.uaf.edu:16080/PDFs/ACIA_Science_Chapters_Final/ACIA_Ch06_Final.pdf]. The long term trend has been evident since the 1800s – i.e. since before CO2 could impact the climate.
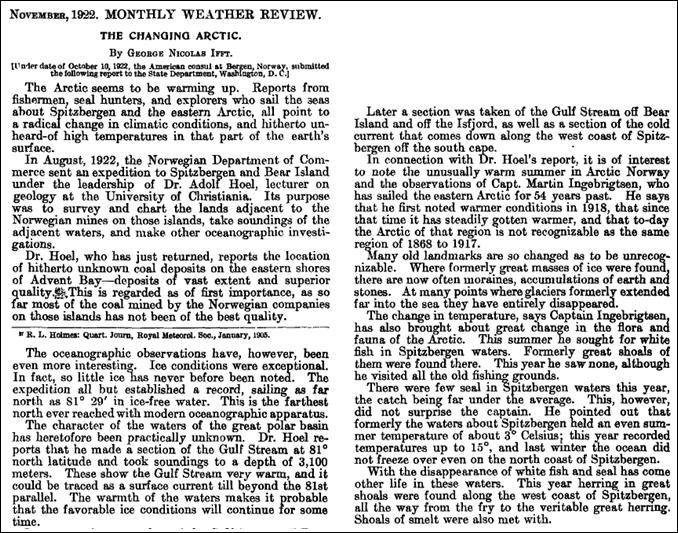
The monthly Weather Review reported [http://docs.lib.noaa.gov/rescue/mwr/050/mwr-050-11-0589a.pdf]: “The arctic seems to be warming up. Reports from fishermen, seal hunters, and explorers who sail the seas about Spitzbergen and the eastern Arctic, all point to a radical change in climatic conditions , and hitherto unheard-of high temperatures in that part of the earth’s surface. … Ice conditions were exceptional. In fact, so little ice has never before been noted. … In Arctic Norway… where formerly great masses of ice were found, there are now often moraines, accumulations of earth and stones. At many points where glaciers formerly extended far into the sea they have entirely disappeared.” But the year was 1922:
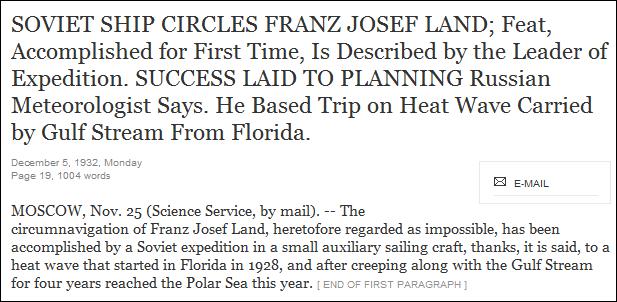
And in 1932 the New York Times [http://select.nytimes.com/gst/abstract.html?res=F60911F73A5513738DDDAC0894DA415B828FF1D3&scp=9&sq=pole+circumnavigation&st=p] reported:
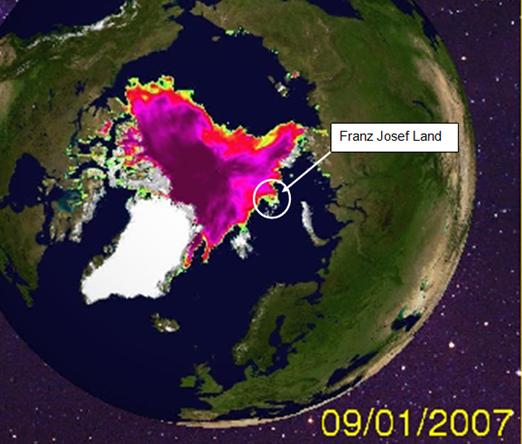
Even at the recent record lowest ice extent in 2007, Franz Josef Land could not be circumnavigated:
|
