Global Warming Science - www.appinsys.com/GlobalWarming
Nature Admits: There is No Real Evidence of Anthropogenic Global Warming
[last update: 2012/10/09; original: 2009/12/29]
|
“Nature” – the “International weekly journal of science” published an editorial (3 Dec 2009 “Climatologists Under Pressure” [http://www.nature.com/nature/journal/v462/n7273/full/462545a.html]) admitting there is no real evidence of anthropogenic greenhouse gas warming other than computer models.
|
|
The Politics Part
The Nature editorial states: “The e-mail archives stolen last month from the Climatic Research Unit at the University of East Anglia (UEA), UK, have been greeted by the climate-change-denialist fringe as a propaganda windfall … proof that mainstream climate researchers have systematically conspired to suppress evidence contradicting their doctrine that humans are warming the globe. This paranoid interpretation would be laughable were it not for the fact that obstructionist politicians in the US Senate will probably use it next year as an excuse to stiffen their opposition to the country's much needed climate bill. … If there are benefits to the e-mail theft, one is to highlight yet again the harassment that denialists inflict on some climate-change researchers, often in the form of endless, time-consuming demands for information under the US and UK Freedom of Information Acts. Governments and institutions need to provide tangible assistance for researchers facing such a burden.”
Obviously Nature does not think information should be provided by researchers – just their conclusions.
|
|
The Science Part
The Nature editorial states: “Nothing in the e-mails undermines the scientific case that global warming is real — or that human activities are almost certainly the cause. That case is supported by multiple, robust lines of evidence, including several that are completely independent of the climate reconstructions debated in the e-mails.” It then mentions the usual symptoms: “glacier retreat, thinning and areal reduction of Arctic sea ice, reductions in permafrost and accelerated loss of mass from the Greenland and Antarctic ice sheets … the global sea level is rising … spring is arriving earlier each year.”
So where are the “robust lines of evidence” for causation?
“Denialists often maintain that these changes are just a symptom of natural climate variability. But when climate modellers test this assertion by running their simulations with greenhouse gases such as carbon dioxide held fixed, the results bear little resemblance to the observed warming. The strong implication is that increased greenhouse-gas emissions have played an important part in recent warming, meaning that curbing the world's voracious appetite for carbon is essential”.
That’s it – running model simulations. That’s all there is. No real evidence. The models don’t work without CO2. Just curb your appetite. If there was actual empirical evidence of CO2 causation they would have mentioned it.
Update 2012/10/09: Models do not match reality (new section at end)
|
|
Science
One of the most disturbing aspects of Nature’s promotion of the global warming scare (besides the name calling of anyone who questions it) is their lack of understanding of the scientific method.
Scientific Method: The scientific method involves four steps geared towards finding truth:
The use of models is a valid part of science – it is often involved in steps 2 and 3 above.
Step 1 – warming and other symptoms have been observed. Step 2 – CO2 was hypothesized to explain it. Step 3 – Models have been created; the doomsday future has been forecast. Step 4 – Oops – Nature forgot this one – they think step 4 is: promote incomplete science as a belief.
|
|
The Models
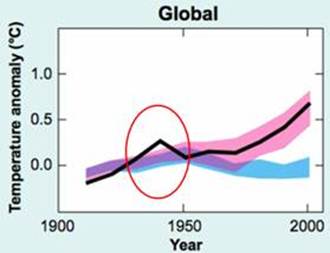
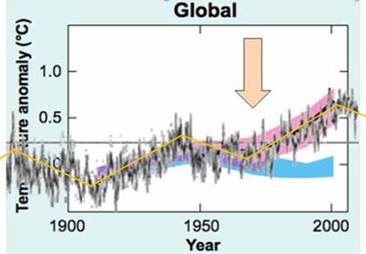
The following figure (left) is from the IPCC AR4 Summary for Policymakers figure SPM-4 [http://www.ipcc.ch/pdf/assessment-report/ar4/syr/ar4_syr_spm.pdf]. It shows “observed” global annual average temperature anomaly (black), model simulations with only natural forcings (blue) and models including anthropogenic greenhouse gases (pink). The models cannot simulate the warming that occurred in the 1930s-1940s. The right-hand figure shows the Hadley global temperature data used by the IPCC superimposed on their “summary” graph (from the Hadley Climatic Research Unit (CRU) which provides the data used by the IPCC [http://hadobs.metoffice.com/hadcrut3/diagnostics/global/nh+sh/]).
The models need input of CO2 only after about 1970 – prior to 1970 all warming was natural, according to the IPCC. In fact one of the CRU emails (between Edward Cook and Michael Mann in May 2001) stated: “most researchers in global change research would agree that the emergence of a clear greenhouse forcing signal has really only occurred since after 1970. I am not debating this point, although I do think that there still exists a significant uncertainty as to the relative contributions of natural and greenhouse forcing to warming during the past 20-30 years at least.” [http://www.eastangliaemails.com/emails.php?eid=228&filename=988831541.txt]
James Hansen, NASA’s main modeler reported in 2007: “It may be fruitless to search for an external forcing to produce peak warmth around 1940. It is shown below that the observed maximum is due almost entirely to temporary warmth in the Arctic. Such Arctic warmth could be a natural oscillation (Johannessen et al. 2004), possibly unforced. Indeed, there are few forcings that would yield warmth largely confined to the Arctic. Candidates might be soot blown to the Arctic from industrial activity at the outset of World War II, or solar forcing of the Arctic Oscillation (Shindell et al. 1999; Tourpali et al. 2005) that is not captured by our present model. Perhaps a more likely scenario is an unforced ocean dynamical fluctuation with heat transport to the Arctic and positive feedbacks from reduced sea ice.” (from Hansen et al 2007 “Climate simulations for 1880–2003 with GISS modelE” Clim Dyn (2007) 29:661–696 [http://pubs.giss.nasa.gov/docs/2007/2007_Hansen_etal_3.pdf])
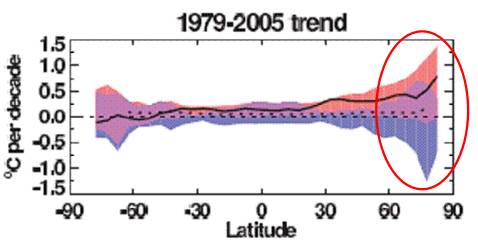
The following figure is from the IPCC Fourth Assessment Report (AR4) Figure 9.6 (2007). It shows the change in temperature (C per decade) by latitude. The black line shows the observed temperature, the blue band shows the output of the computer models including only natural factors, whereas the pink band shows the output of computer models including anthropogenic CO2. Notice that the models with only natural factors (blue shaded area) can explain all of the warming for most of the world up to 30 degrees north latitude. This figure also shows that the recent warming is mainly in the Arctic.
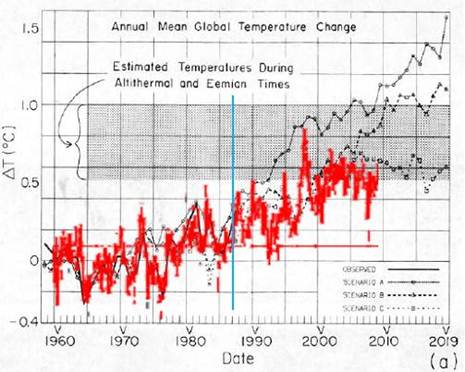
James Hansen is one of the biggest promoters of the anthropogenic CO2 global warming (AGW) scare. And yet his own work shows that the AGW theory is false. In 1988 he provided temperature predictions based on climate models (results of which he presented to the US congress to promote the scare). He modeled three scenarios: ‘A’ had an increasing rate of CO2 emissions, ‘B’ had constant rate of CO2 emissions, while scenario ‘C’ had reduced CO2 emissions rate from 1988 levels into the future “such that the greenhouse gas climate forcing ceases to increase after 2000” [http://pubs.giss.nasa.gov/abstracts/1988/Hansen_etal.html].
The following figure superimposes the Hadley temperature anomaly data used by the IPCC and shown previously (superimposed on the IPCC global model plot and here changed to red) on Hansen’s 1988 model projections. The vertical blue line indicates the year in which the projections were made. (The zero level is different since Hansen used 1951-1980 as the base period for the calculation of temperature anomalies, while the IPCC currently uses 1961-1990.) The actual data are below Hansen’s modeled scenario C that had reduced CO2 levels.
In the 20 years since Hansen’s model projections, the global temperature is below the scenario ‘C’ in which “the greenhouse gas climate forcing ceases to increase after 2000”. So his scenario ‘C’ most closely matches reality. But there is a problem: CO2 has continued to increase. Obviously there is a problem with the models.
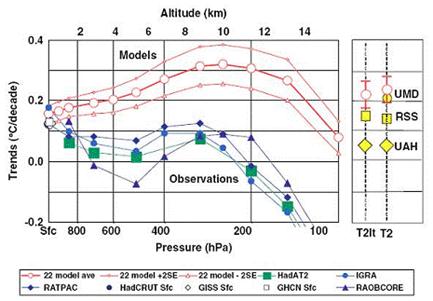
The IPCC 2007 Report Chapter 9 – Understanding and Attributing Climate Change [http://ipcc-wg1.ucar.edu/wg1/Report/AR4WG1_Print_Ch09.pdf] provides a climate model based simulation of the expected CO2 “spatial signature” of all forcings including anthropogenic CO2 (left-hand figure below shows degrees change per decade). However, a study of actual data from radiosonde data shows a non-CO2 based signature [http://www.climatescience.gov/Library/sap/sap1-1/finalreport/sap1-1-final-chap5.pdf]. The models do not match reality. In reference to this, MIT Atmospheric Sciences Professor Richard Lindzen stated: “surface warming should be accompanied by warming in the tropics around an altitude of about 9km that is about 2.5 times greater than at the surface. … This further implies that all models predicting significant warming are greatly overestimating warming. This should not be surprising (though inevitably in climate science, when data conflicts with models, a small coterie of scientists can be counted upon to modify the data. Thus, Santer, et al (2008), argue that stretching uncertainties in observations and models might marginally eliminate the inconsistency. That the data should always need correcting to agree with models is totally implausible and indicative of a certain corruption within the climate science community).” [http://www.quadrant.org.au/blogs/doomed-planet/2009/07/resisting-climate-hysteria]
Trends in degrees per decade – left: IPCC CO2-based trend; right: actual data
A 2007 study comparing the models to observations from satellites and balloons (1979-2004) also shows a problem with the models. The following figure is from the study Douglass et al “A comparison of tropical temperature trends with model predictions”, International Journal of Climatology. [http://www.scribd.com/doc/904914/A-comparison-of-tropical-temperature-trends-with-model-predictions]. The models exhibit the CO2 theory of most warming occurring in the troposphere. However, the satellite and balloon based observations show warming only at the surface of the earth. The report stated: “Model results and observed temperature trends are in disagreement in most of the tropical troposphere”
A 2009 paper states: “There appears to be something fundamentally wrong with the way temperature and carbon are linked in climate models” [http://www.rice.edu/nationalmedia/news2009-07-14-globalwarming.shtml]
|
|
No Empirical Evidence = Incomplete Science
Without Step 4 of the scientific method, the science is incomplete – i.e. not conclusive. Models do not necessarily represent reality. Without empirical evidence to support them, the models are pure speculation.
Nature has become a political advocate: “curbing the world's voracious appetite for carbon is essential” Science has been abandoned.
|
|
Climate Models Do Not Match Reality
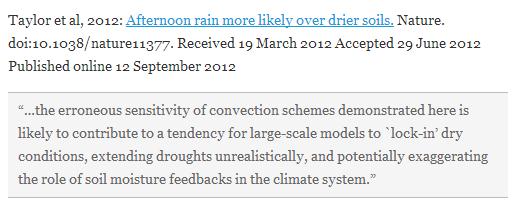
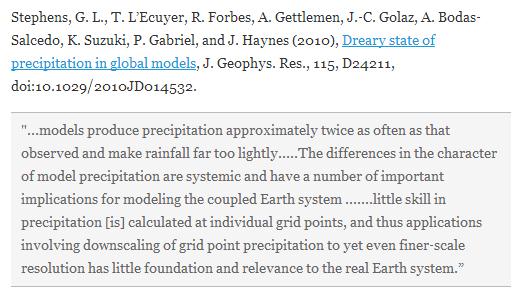
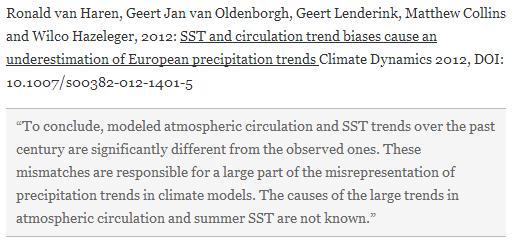
[2012/10/09] Roger Pielke Sr. has compiled quotes from papers showing that climate models do not match reality.
A couple of his quotes (use the above link to see them all)
|
|
|