Global Warming Science - www.appinsys.com/GlobalWarming
Hansen’s Global Temperature
[last update: 2010/04/11]
|
NASA’s James Hansen is the United States’ leading scientific alarmist about global warming. He believes global warming is accelerating. Apparently it’s his revisions of the data that are causing the acceleration.
This document examines the historical revision in the global temperature change as defined by Hansen over the decades. Hansen’s global temperature graphs are examined from 1981 to 2007.
Most of his publications are referenced here: http://pubs.giss.nasa.gov/authors/jhansen.html
|
|
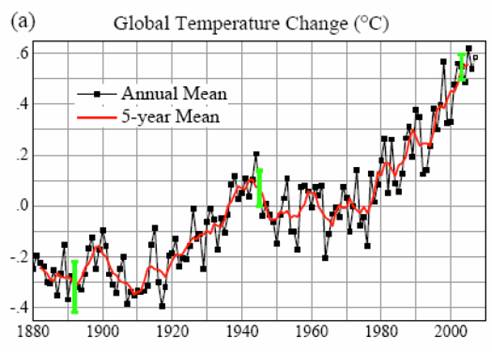
Hansen 2007
Hansen et al “GISS Temperature Analysis through November” [http://www.columbia.edu/~jeh1/mailings/2007/20071210_GISTEMP.pdf]
Fig 1: “Annual surface temperature anomaly relative to 1951-1980 mean, based on surface air measurements at meteorological stations and ship and satellite measurements of sea surface temperature; the 2007 point is the 11-month anomaly. Green error bar is estimated 2σ uncertainty based on quantified effect of incomplete spatial coverage and partly subjective estimate of data quality problems.”
(Note: This is the same figure as presented in Hansen et al “Global Temperature Change” 2006 [http://pubs.giss.nasa.gov/docs/2006/2006_Hansen_etal_1.pdf] with the addition of one data point for 11 months of 2007)
|
|
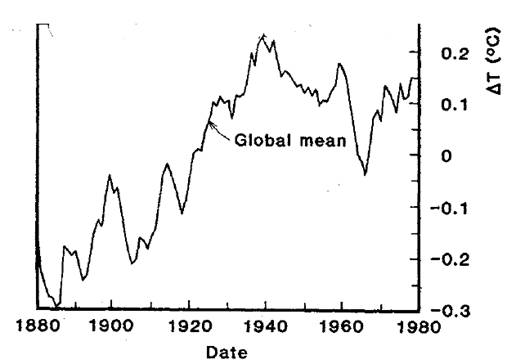
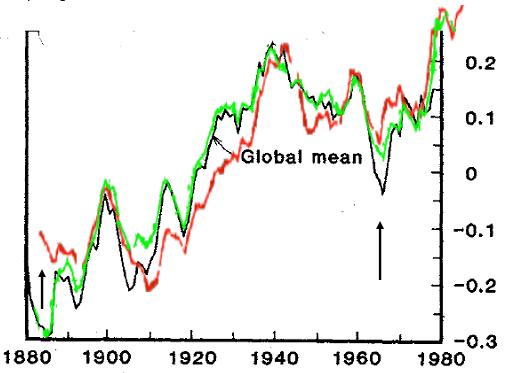
Hansen 1981
Hansen et al “Climate Impact of Increasing Atmospheric Carbon Dioxide” [http://pubs.giss.nasa.gov/docs/1981/1981_Hansen_etal.pdf]
“Fig. 3. Observed surface air temperature trends … smoothed with a 5-year running mean.”
Comparing Hansen 2007 with Hansen 1981:
|
|
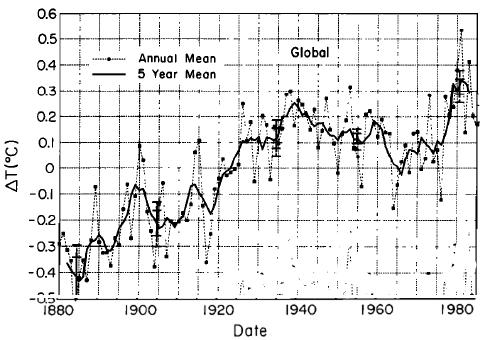
Hansen 1987
Hansen and Lebedeff “Global trends of measured surface air temperature” [http://pubs.giss.nasa.gov/docs/1987/1987_Hansen_Lebedeff.pdf]
“Fig. 6. Global mean surface air temperature change estimated from meteorological station records.”
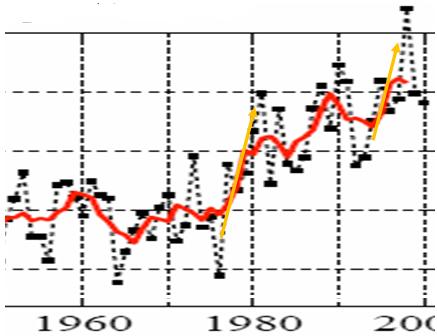
Comparing Hansen 2007 with Hansen 1987 and Hansen 1981:
There is a progressive reduction in the 1965 dip in the revised historical data over the decades.
|
|
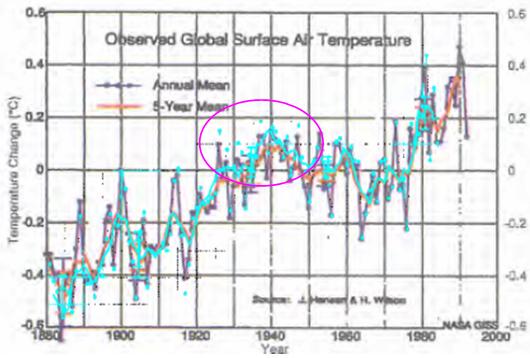
Hansen 1993
Hansen et al “Long-term Monitoring of Global Climate Forcings and Feedbacks” [http://pubs.giss.nasa.gov/docs/1993/1993_Hansen_etal_2.pdf]
“Fig. S.1. Observed global temperature”
Comparing Hansen 1987 and Hansen 1993:
The warm years in the 1930s-1940s were reduced between 1987 and 1993. The cold years in the same period were warmed so that the average is very nearly the same but warm years and variation have been reduced.
|
|
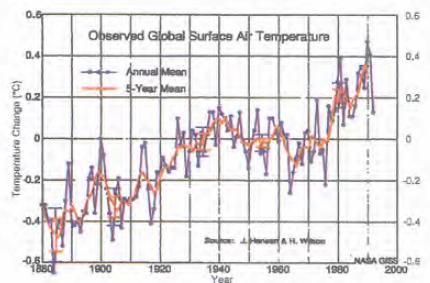
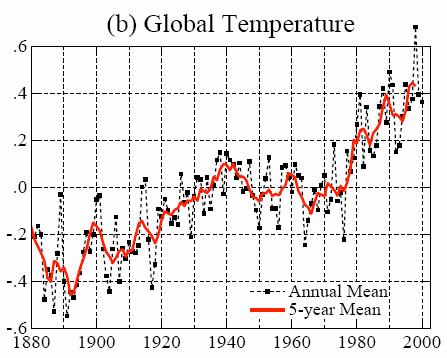
Hansen 2001
Hansen et al “A closer look at United States and global surface temperature change” [http://pubs.giss.nasa.gov/docs/2001/2001_Hansen_etal.pdf]
“Plate 6. (b) global annual and 5-year running-mean surface air temperature based on the meteorological stations.”
Comparing Hansen 2007 with Hansen 2001
For the Hansen 2007 data, the 1980s – 1990s temperatures were reduced from the Hansen 2001. The 1998 El Nino was reduced from 0.7 to below 0.6 (and less than the 2005 anomaly). The effect of this is to pretend that the warming trend is increasing.
It also helps to hide the fact that most of the warming occurred in just two very short periods: the 1976-1980 climate shift and the 1997-1998 El Nino more readily seen in the 2001 than in the 2007 revision.
|
|
Met Office / Hadley
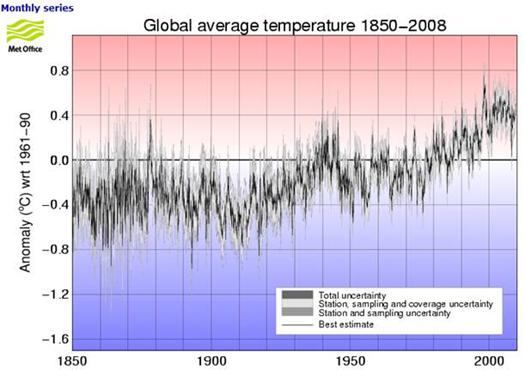
The following figure shows the Hadley Climatic Research Unit global average temperature anomalies through 2008 (the IPCC uses data provided by HadCRU – plot from: [http://hadobs.metoffice.com/hadcrut3/diagnostics/global/nh+sh/]).
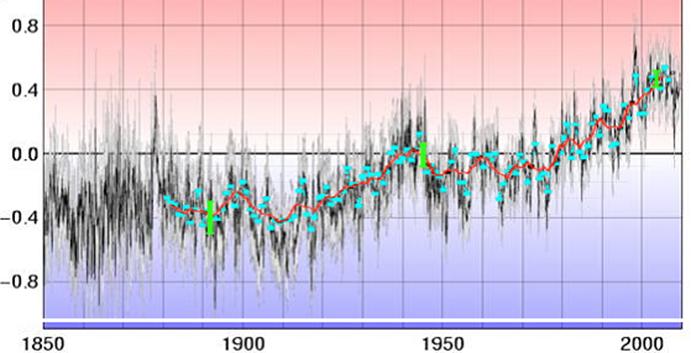
The following figure shows the Hadley plot with Hansen 2007 superimposed (Hadley and Hansen use different base periods for the calculation of anomalies, so the zero point is at a different location).
Hansen removed most of the dips in the data (i.e. ca. 1910, 1923, 1947, 1965, 1975). Hansen shows 2005 as the warmest year whereas Hadley shows 1998 as the warmest year. Hansen’s 2-sigma error bars (green) are very misleading compared to the range exhibited in the Hadley data.
|
|
Hansen’s Predictions
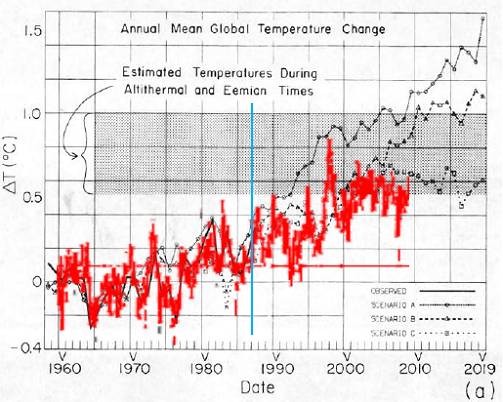
In 1988 Hansen testified before the US Congress to initiate the global warming scare amongst government. He provided temperature predictions based on climate models including three scenarios: ‘A’ had an increasing rate of CO2 emissions, ‘B’ had constant rate of CO2 emissions, and scenario ‘C’ had reduced CO2 emissions rate from 1988 levels into the future “such that the greenhouse gas climate forcing ceases to increase after 2000” (Hansen 1988, [http://pubs.giss.nasa.gov/abstracts/1988/Hansen_etal.html]).
The following figure is from Hansen 1988, showing the “observed” global temperature (solid black line) along with model outputs for the three future CO2 scenarios. (The shaded area is the estimate of global temperature during the peak of the current and previous interglacial periods 6,000 and 120,000 years ago.) The Hadley temperature anomaly data used by the IPCC and shown previously is superimposed (red) on Hansen’s 1988 model projections. The vertical blue line indicates the year in which the projections were made. (Note: The zero level is different since Hansen used 1951-1980 as the base period for the calculation of temperature anomalies, while the IPCC currently uses 1961-1990.)
The reason for Hansen’s periodic revision of the climate history: the data in the last two decades has not matched his predictions. It most closely matches his scenario C – reduced CO2 emissions.
For more information on Hansen’s modeling see: http://www.appinsys.com/GlobalWarming/HansenModel.htm
|
|
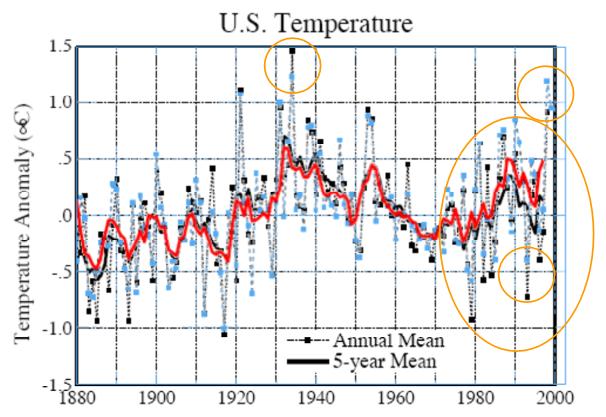
Hansen’s U.S. Temperatures
Hansen did similar manipulations on the US data to increase the late 20th century warming, since the US has been lagging the globe and has not been showing significant warming.
Hansen et al 1999 [http://pubs.giss.nasa.gov/docs/1999/1999_Hansen_etal.pdf] (in which the warmest year is 1934):
Hansen et al 2001 [http://pubs.giss.nasa.gov/docs/2001/2001_Hansen_etal.pdf] (in which the 1908s and 1990s temperatures have been increased and the 1930s decreased):
Superimposing Hansen 2001 (red / blue) onto Hansen 1999 (black), and highlighting some of the significant changes:
|
|
Accelerating Warming?
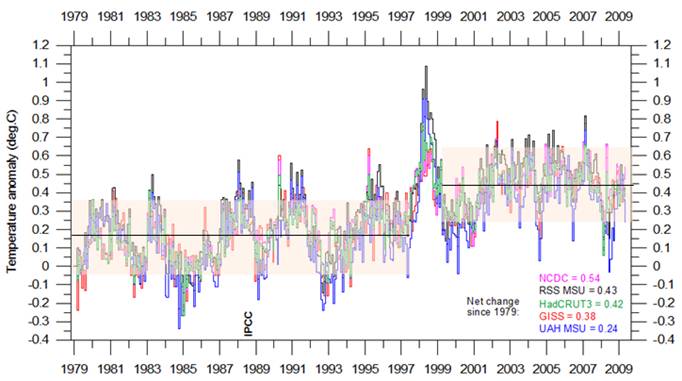
Contrary to Hansen’s scare mongering, warming has not been accelerating. The following figure shows global average temperature from five data sets since the start of the satellite temperature data era in 1979 (RSS MSU and UAH MSU are satellite data, HadCRUT3, NCDC and GISS are surface station data sets – graph from http://climate4you.com/GlobalTemperatures.htm). From 1979 to 1997 there was no warming trend. The major El Nino then resulted in a residual warming of about 0.3 degrees. Since the 1998 end of the El Nino there has also been no warming trend – all of the warming in the last 30 years occurred as a result of the 1997-98 El Nino. And yet this is the era that the IPCC says the warming is caused by CO2. (Hansen’s data is the GISS data set.)
In fact the late 20th century warming had a virtually identical “acceleration” as the early 20th century warming.
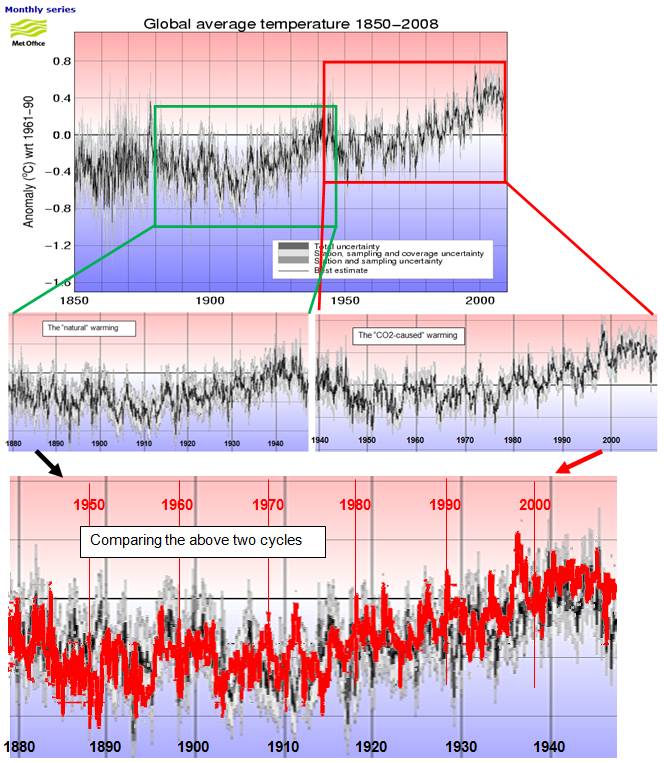
The following figures show the global temperature anomalies from the Hadley figure shown previously. Two cycles have been highlighted in rectangles: the “natural” cycle (1880-1946: green) and the “CO2-caused” cycle (1942-2008: red), according to the IPCC. The final part of the figure shows the 1942-2008 cycle changed to red and overlaid on the 1880-1946 cycle (vertically shifted by 0.3 degrees).
As can be seen from the above figures, the two cycles were nearly identical, and yet Hansen and the IPCC say the models can explain the early 1900s cycle with only natural forcings, but anthropogenic CO2 is needed for the later cycle. There appears to be a serious problem with the models when two identical cycles have two very different causes.
There is an overall upwards net trend between the cycles (about 0.3 degrees C per approx. 60 year cycle) due to the fact that the earth has been warming since the Little Ice Age: “The coldest time was during the 16th and 17th Centuries. By 1850 the climate began to warm.” [http://www.windows.ucar.edu/tour/link=/earth/climate/little_ice_age.html]
|
|
Hansen’s Alarmism
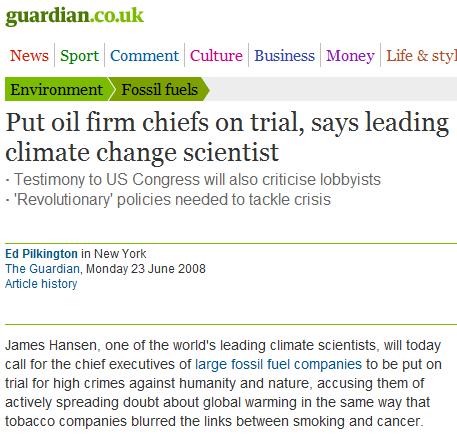
James Hansen has become one of the most outspoken anthropogenic global warming alarmists.
Example:
But he wasn’t always a warmist:
“On July 9, 1971, the Post published a story headlined "U.S. Scientist Sees New Ice Age Coming." It told of a prediction by NASA and Columbia University scientist S.I. Rasool. The culprit: man's use of fossil fuels. The Post reported that Rasool, writing in Science, argued that in "the next 50 years" fine dust that humans discharge into the atmosphere by burning fossil fuel will screen out so much of the sun's rays that the Earth's average temperature could fall by six degrees. Aiding Rasool's research, the Post reported, was a "computer program developed by Dr. James Hansen," who was, according to his resume, a Columbia University research associate at the time.” [http://www.ibdeditorials.com/IBDArticles.aspx?id=275267681833290&kw=Climate,Change,James,Hansen] Washington Post Article: [http://pqasb.pqarchiver.com/washingtonpost_historical/access/144703752.html?dids=144703752:144703752&FMT=ABS&FMTS=ABS]
|
|
Hansen’s Payback$
James Hansen has become one of the most financially rewarded government employed alarmists.
Examples:
“Climate scientist Hansen wins $100,000 prize” [http://www.reuters.com/article/idUSTRE63636N20100407] “U.S. climate scientist James Hansen won a $100,000 environmental prize Wednesday [2010 Apr 7] for decades of work trying to alert politicians to what he called an unsolved emergency of global warming. … Hansen, born in 1941, will visit Oslo in June to collect the Sophie Prize, set up in 1997 by Norwegian Jostein Gaarder, the author of the 1991 best-selling novel and teenagers' guide to philosophy "Sophie's World." … “We really have an emergency,” Hansen said”
The Heinz Center for Science, Economy and the Environment (run by John Kerry’s wife Teresa Heinz) gave Hansen $250,000 in 2001 for promoting the AGW scare [http://canadafreepress.com/index.php/article/3671] (Enron’s Ken Lay was one of the founding board members of the Heinz Center (http://transcripts.cnn.com/TRANSCRIPTS/0407/12/lkl.00.html], and Enron was one of the biggest promoters of the Kyoto cap and trade.)
George Soros’ Open Society Institute gave Hansen $720,000 to promote alarmist claims
|