www.appinsys.com/GlobalWarming
Global Warming – the Short Version of Why the Anthropogenic CO2 Theory is Wrong
[last update: 2009/03/21]
Models Only Require Anthropogenic CO2 After 1970 |
|
|
|
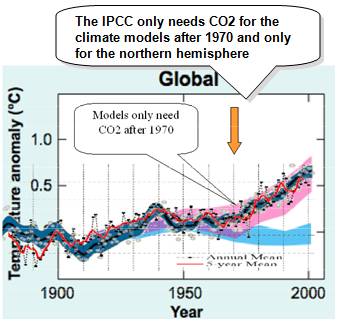
The media stories often report temperature increases over the last century and attribute it to anthropogenic (human caused) CO2 based global warming. The official position of the IPCC, however, is that anthropogenic CO2 has only caused warming since 1970.
This figure shows the IPCC model simulations (IPCC figure SPM-4 in the 2007 AR4 Summary for Policy Makers). The blue band shows the results of model simulations using only natural forcings. The pink band shows the results of model simulations including anthropogenic CO2. All of the warming in the 1900s prior to 1970 can be modeled with natural causes only – i.e. anthropogenic CO2 only has an effect in the models after 1970.
Even though the IPCC released this figure in 2007, it only shows temperatures up to the year 2000. The reason why is examined in an item below.
There is no empirical evidence of CO2 causing global warming – the only evidence is the output of computer models – Global Circulation Models (GCMs).
See also: http://www.appinsys.com/GlobalWarming/gw_nutshell.htm |
|
|
|
Solar Magnetic Flux Explains the Warming |
|
|
|
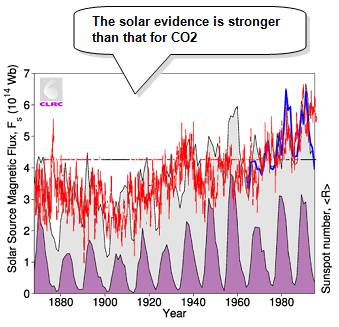
This figure shows global average temperature (red) from the Hadley Climatic Research Unit data at the UK meteorology office [http://hadobs.metoffice.com/hadcrut3/diagnostics/global/nh+sh/], superimposed on the total solar magnetic flux (black line bounding grey shading and blue line) along with the annual sunspot number (shaded purple). The solar figure is from M. Lockwood, R. Stamper, and M.N. Wild: “A Doubling of the Sun's Coronal Magnetic Field during the Last 100 Years”, Nature Vol. 399, 3 June 1999 [http://www.ukssdc.ac.uk/wdcc1/papers/nature.html]) which states: “The magnetic flux in the solar corona has risen by 40% since 1964 and by a factor of 2.3 since 1901.”
This shows that even since 1970, the global temperature increase can be explained based on solar inputs. The IPCC model problem is that solar magnetic flux is not included in the models. The IPCC (AR4) report (The Physical Basis of Climate Change, 2007 [http://ipcc-wg1.ucar.edu/wg1/wg1-report.html]) states that: “The direct RF [radiative forcing] due to increase in solar irradiance is reduced from the TAR [Third Assessment Report]”. The problem is that it is not currently understood how the sun can influence the earth’s climate. In addition the 4AR states: “There is more uncertainty regarding the influence of solar forcing. In addition to substantial uncertainty in the timing and amplitude of solar variations on time scales of several decades to centuries, which has increased since the TAR although the estimate of solar forcing has been revised downwards”.
See also: http://www.appinsys.com/GlobalWarming/GW_Part6_SolarEvidence.htm
|
|
|
|
Satellite Data Shows No CO2 Based Warming |
|
|
|
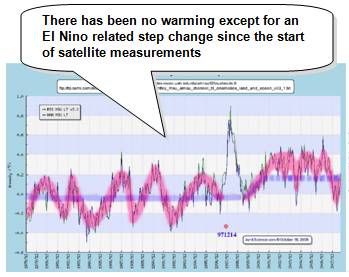
Satellite measurement of global temperatures began in 1979. This figure shows the complete record of global satellite temperature for the lower troposphere (near the Earth’s surface) from 1979 to the end of 2008. The 1998 El Nino can clearly be seen as a temporary spike in temperatures. [http://icecap.us/images/uploads/ThereWasNoGlobalWarmingBefore1997(February15th2009).pdf]
Before the 1998 El Nino there was no warming trend in the 1980s and 1990s. The 1998 El Nino resulted in a step change of temperature of about 0.2C. After the 1998 El Nino there has been no warming trend in the 2000s.
|
|
|
|
No Warming Has Occurred Since the 1998 El Nino |
|
|
|
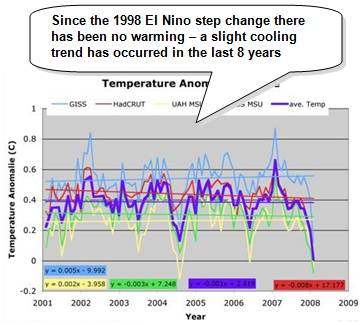
This figure shows a comparison of the satellite temperature data (UAH MSU and RSS MSU) with the NASA-GISS and HadCRU data from 2001 to 2008. The recent eight-year period shows no warming (although NASA’s adjustments to the data produce slight warming). (Figure from http://rankexploits.com/musings/2008/ipcc-projections-overpredict-recent-warming/])
This is why the IPCC temperature plot shown above from the AR4 released in 2007 does not show temperatures past the year 2000. Even though the atmospheric CO2 has steadily increased, the temperatures have not.
See also: http://www.appinsys.com/GlobalWarming/GW_Part2_GlobalTempMeasure.htm |
|
|
|
Sea Level Has Been Rising Since the 1800s |
|
|
|
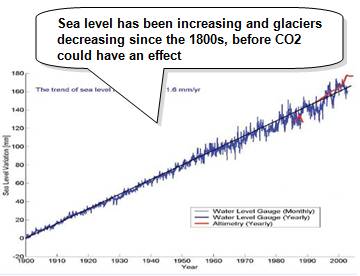
Sea level rises in some locations and falls in others around the world (mainly due to isostatic rebound from the last ice age). Overall, the average sea level has been rising by about 1.5 mm / year since measurements began.
This figure shows cumulative sea level change for 1900 to 2002 and shows a linear trend that shows no increase in rate since measurements began [http://www.wamis.org/agm/meetings/rsama08/S304-Shum_Global_Sea_Level_Rise.pdf]. Since according to the IPCC, CO2-based warming is only evident since the 1970s, all of this sea level rise since prior to 1970 cannot be caused by anthropogenic CO2, and yet the trend has not increased.
See also: http://www.appinsys.com/GlobalWarming/GW_4CE_SeaLevel.htm
A similar trend exists for the decrease in glaciers around the world – glaciers have been declining since the early 1800s.
See also: http://www.appinsys.com/GlobalWarming/GW_4CE_Glaciers.htm
|
|
|
|
Global Warming Isn’t Global |
|
|
|
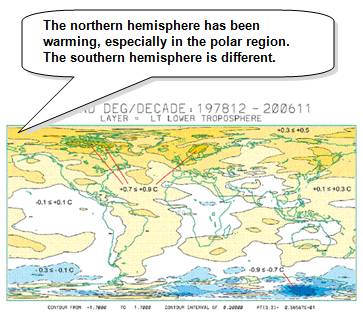
The University of Alabama at Huntsville provides monthly plots of worldwide temperature anomalies for the troposphere since 2000 [http://climate.uah.edu/]. This figure (left) is from UAH and shows the temperature trend (degrees per decade) from 1978 to 2006 (the longest term plot of this type available). Longer term graphs of hemispheric average temperatures also indicate a major difference between the northern and southern hemispheres. According to the CO2 theory, warming should be occurring over both poles – but this is not happening.
The following figure from the 2007 IPCC AR4 Figure 9.6 shows that for most of the Earth (south of 30 degrees North latitude) the climate models explain all of the warming without CO2 (blue shaded area). The warming is a northern hemisphere phenomenon.
See also: http://www.appinsys.com/GlobalWarming/GW_NotGlobal.htm
|
|
|
|
Models Indicate Warming Not Due To CO2 |
|
|
|
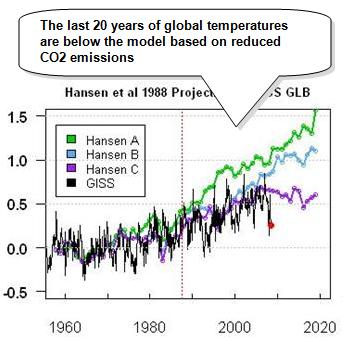
In 1988 NASA’s climate alarmist James Hansen provided temperature predictions based on climate models (the results of which he presented to the US congress). He modeled three scenarios: A had an increasing rate of CO2 emissions, B had constant rate of CO2 emissions, whereas scenario C had reduced CO2 emissions rate from 1988 levels into the future.
This figure compares Hansen’s 1988 predictions with actual temperature data since then. It compares the NASA GISS global data (as compiled by Hansen) with his model projections. (Figure from [http://www.climateaudit.org/?p=3354]). While actual atmospheric CO2 levels have increased since 1988, the fact that actual temperatures are similar to the reduced CO2 models implies a problem with the models – the temperature increase is not due to CO2.
See also: http://www.appinsys.com/GlobalWarming/HansensPredictions1988.htm
See also: http://www.appinsys.com/GlobalWarming/EasterbrookPredictions.htm |
|
|
|
Models’ Reliance on H2O Feedback Incorrect |
|
|
|
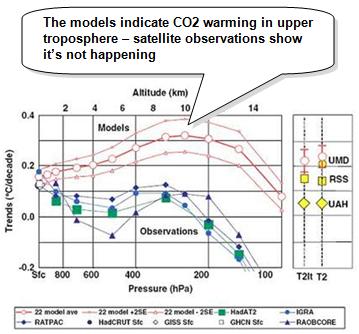
This figure is from [http://www.scribd.com/doc/904914/A-comparison-of-tropical-temperature-trends-with-model-predictions] comparing the climate models to observations from satellites and balloons (1979-2004).The models exhibit the CO2 theory characteristic of most warming occurring in the troposphere. However, the satellite and balloon based observations show warming only at the surface of the earth. The report stated: “Model results and observed temperature trends are in disagreement in most of the tropical troposphere”
Increasing atmospheric CO2 does not by itself result in significant warming. The climate models assume a significant positive feedback of increased water vapor in order to amplify the CO2 effect and achieve the future warming reported by the IPCC. The specific humidity has been increasing over the last few decades near the Earth’s surface, while it has been decreasing in the upper troposphere. The increase in specific humidity at the Earth’s surface is related to surface temperatures. The decreasing specific humidity in the upper troposphere indicates that the warming at the Earth’s surface does not match the CO2 based warming theory. Other studies have found “The upper-level negative trends in q are inconsistent with climate-model calculations ... [this] would imply that long-term water vapor feedback is negative—that it would reduce rather than amplify the response of the climate system to external forcing such as that from increasing atmospheric CO2”
See also: http://www.appinsys.com/GlobalWarming/WaterVapor.htm |
|
|
|
Oceanic Oscillations Correlate with Temperature |
|
|
|
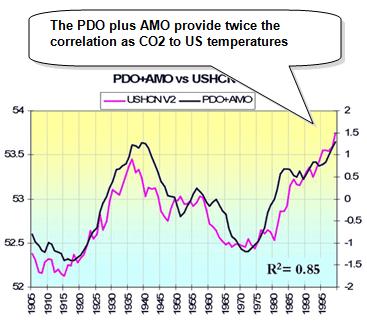
The Pacific Decadal Oscillation (PDO) was identified in the late 1990s, while the Atlantic Multi-Decadal Oscillation (AMO) was identified in 2000. This figure compares the PDO+AMO with the US average annual temperatures with an r-squared of 0.85 between the two – an extremely good correlation [http://www.intellicast.com/Community/Content.aspx?a=127].
A 2008 study – “Oceanic Influences on Recent Continental Warming”, [http://www.cdc.noaa.gov/people/gilbert.p.compo/CompoSardeshmukh2007a.pdf] states: “Evidence is presented that the recent worldwide land warming has occurred largely in response to a worldwide warming of the oceans rather than as a direct response to increasing greenhouse gases (GHGs) over land. Atmospheric model simulations of the last half-century with prescribed observed ocean temperature changes, but without prescribed GHG changes, account for most of the land warming. … Several recent studies suggest that the observed SST variability may be misrepresented in the coupled models used in preparing the IPCC's Fourth Assessment Report, with substantial errors on interannual and decadal scales.”
The PDO also correlates with the solar Hale cycle.
|
|
|
|
Mars Has Also Been Warming |
|
|
|
The planet Mars is also exhibiting a warming trend. A 2007 National Geographic article [http://news.nationalgeographic.com/news/2007/02/070228-mars-warming.html] states: “Simultaneous warming on Earth and Mars suggests that our planet's recent climate changes have a natural—and not a human-induced—cause…. Habibullo Abdussamatov, head of space research at St. Petersburg's Pulkovo Astronomical Observatory in Russia, says the Mars data is evidence that the current global warming on Earth is being caused by changes in the sun. "The long-term increase in solar irradiance is heating both Earth and Mars," he said.”
The principal investigator for the Mars Orbiter Camera said: “The images, documenting changes from 1999 to 2005, suggest the climate on Mars is presently warmer, and perhaps getting warmer still, than it was several decades or centuries ago” [http://www.abc.net.au/science/news/stories/2005/1464931.htm]. William Feldman of the Los Alamos National Laboratory (who is involved with NASA's Mars Odyssey orbiter) says: “One explanation could be that Mars is just coming out of an ice age” [http://www.space.com/scienceastronomy/mars_ice-age_031208.html].
There’s no anthropogenic CO2 on Mars. But both Earth and Mars are coming out of ice ages.
See also: http://www.appinsys.com/GlobalWarming/gw_nutshell.htm
|
|
|
|