Global Warming Science - www.appinsys.com/GlobalWarming
Climatic Events – Precipitation
[last update: 2012/01/10 – HuffPost celebrates Smokey Bear, in expanded wildfires section]
[2011/04/30 – tornado section expanded]
While the global warming scare got rolling, other climatic events have also garnered much alarmist attention.
Precipitation / drought / tornadoes / storms are the focus of this document.
Other documents in this Climatic Events series include:
- Hurricanes
- Polar Ice Caps
- Glaciers
- Sea Level
- Animals (including Polar Bears)
- Human Disease / Death (including Malaria and Extreme Weather)
- North Atlantic Thermohaline Circulation / Gulf Stream
This document also includes sections on
|
|
Precipitation / Drought
|
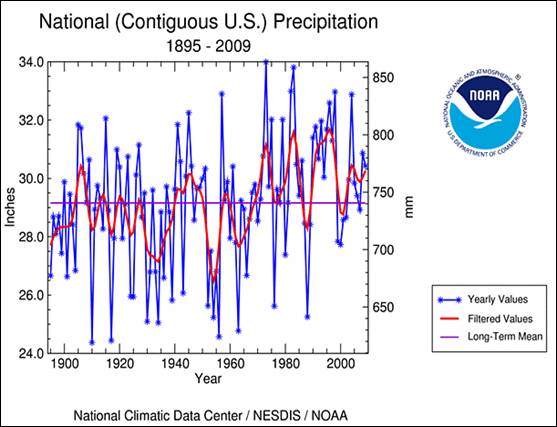
The following figure shows US precipitation for 1895 – 2009 [http://www.ncdc.noaa.gov/sotc/get-file.php?report=national&image=ann/timeseries01&byear=2009&bmonth=01&year=2009&month=12&ext=gif&id=110-00].
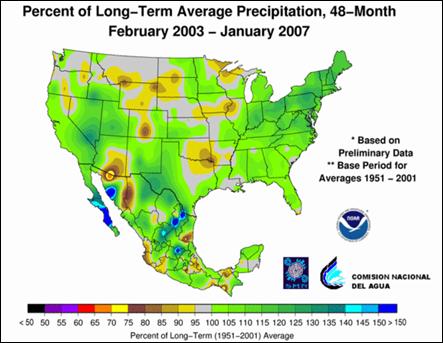
The following figure shows precipitation anomalies for Feb 2003 to Jan 2007.
Precipitation Anomalies [http://www.ncdc.noaa.gov/oa/climate/research/2006/ann/us-summary.html]
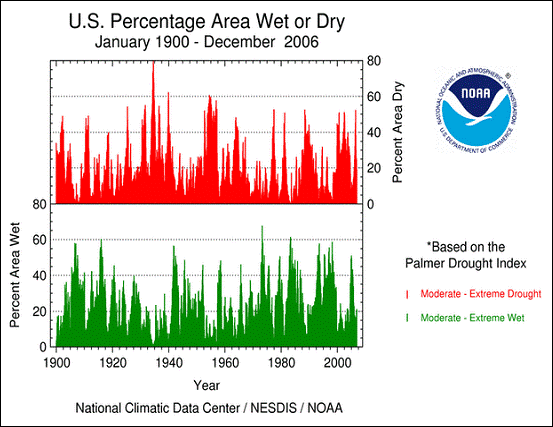
The following figure compares the occurrences of moderate to extreme drought and moderate to extreme wet conditions in the US Feb 1990 to 2006.
Moderate to extreme drought and moderate to extreme wet conditions in the US Feb 1990 to 2006
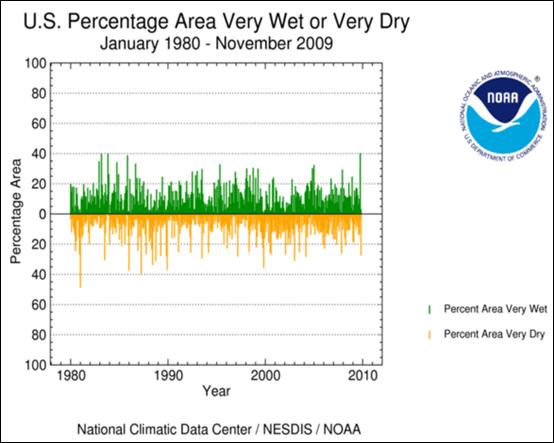
The following figure shows monthly percent wet / dry percent area in the US compared to the 1961 – 1990 average. [http://www.ncdc.noaa.gov/img/climate/research/2009/nov/Reg110_Elem01_paex_01801109_pg.gif]
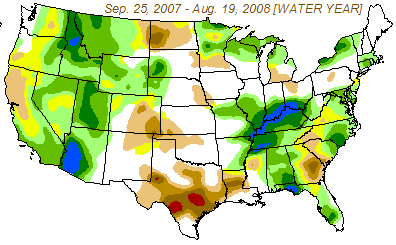
There are always some areas in the US that are experiencing drought or extreme wet, as indicated in the above two figures. The following figure shows the change in drought severity from Sep 2007 to Aug 2008. Drought in southern California and Arizona has lessened, while drought in Texas and Georgia has worsened.
A 2007 study of global droughts from 1901 to 2000 (Narisma et al: “Abrupt changes in rainfall during the twentieth century”, Geophysical Research Letters 34, identified 30 severe and persistent droughts: [http://www.agu.org/pubs/crossref/2007/2006GL028628.shtml])
7 occurred during 1901-1920 7 occurred during 1921-1940 8 occurred during 1941-1960 5 occurred during 1961-1980 3 occurred during 1981-2000
This is not match the climate-alarmist thesis that is propounded by Gore and his followers. [http://www.co2science.org/articles/V10/N29/EDIT.php]
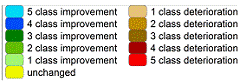
The following figure shows the Extreme Precipitation Index (EPI) values for 1, 5, and 20-year baselines since 1895. (Kunkel et al) [http://www.worldclimatereport.com/index.php/2006/03/15/an-extreme-view-of-global-warming/]
Global
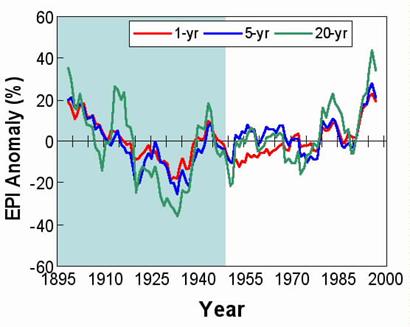
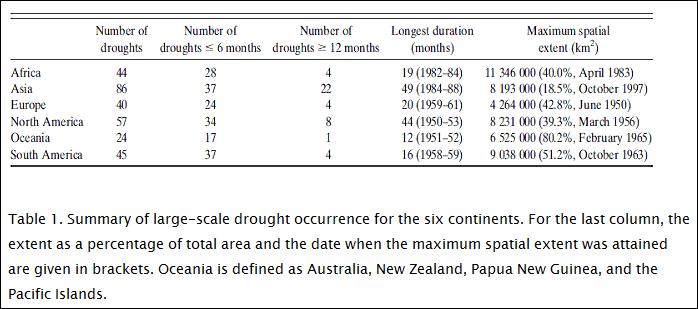
A 2009 study (Sheffield et al, Journal of Climate, [http://ams.allenpress.com/perlserv/?request=get-pdf&doi=10.1175%2F2008JCLI2722.1]) states: “Globally, the mid-1950s showed the highest drought activity and the mid-1970s to mid-1980s the lowest activity.”
The following figure and table are from that study (from
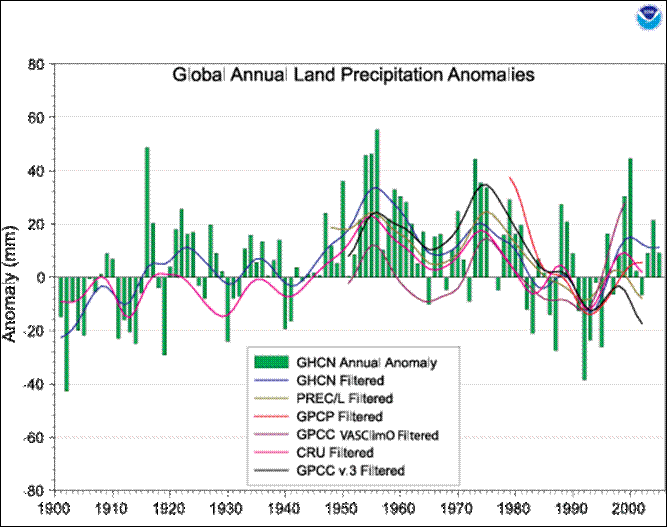
The following figure shows global annual land precipitation anomalies for 1900 to 2005 based on the 1981-2000 mean [http://www.ncdc.noaa.gov/img/climate/globalwarming/ar4-fig-3-12.gif]
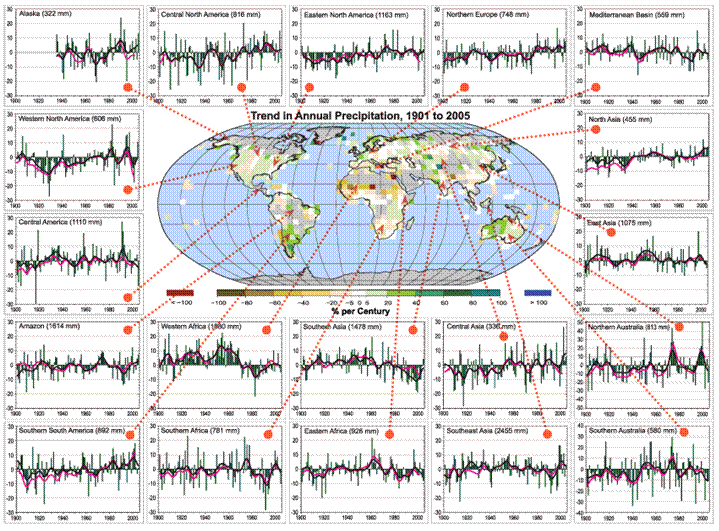
The following figure shows precipitation trends on a regional basis for 1900 - 2005 [http://www.ncdc.noaa.gov/img/climate/globalwarming/ar4-fig-3-14.gif] Areas in grey on the map have insufficient data.
|
|
|
Snow
|
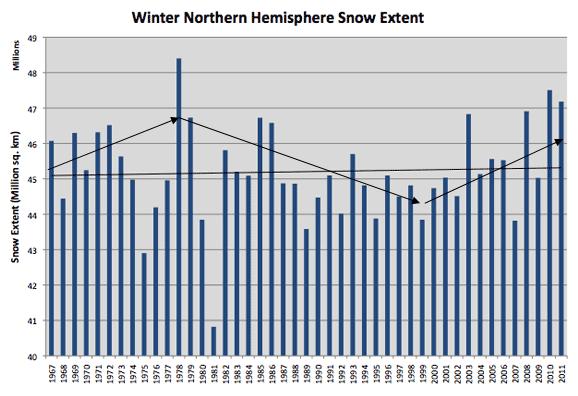
The following figure shows northern hemisphere snow cover for late January from 1967 to 2011. [http://climate.rutgers.edu/snowcover/chart_seasonal.php?ui_set=nhland&ui_season=1]
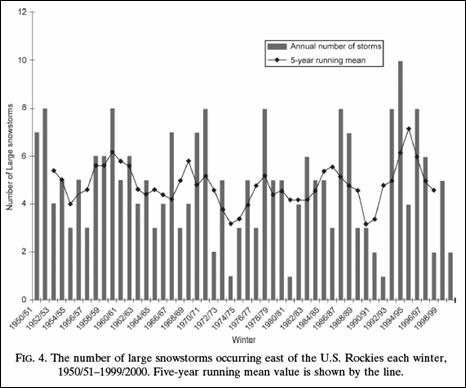
The following figure shows number of large snowstorms for the U.S. east of the Rockies 1950 – 2000, no trend observed (Changnon, D., C. Merinsky, and M. Lawson, 2008. Climatology of surface cyclone tracks associated with large central and eastern U.S. snowstorms, 1950–2000. Monthly Weather Review, 136). [http://ams.allenpress.com/archive/1520-0493/136/8/pdf/i1520-0493-136-8-3193.pdf]
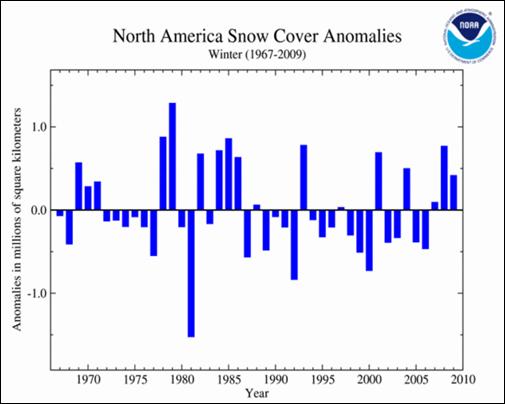
The following figure shows North America snow cover anomalies since 1967. [http://www.ncdc.noaa.gov/img/climate/research/2009/feb/snowcover-namgnld-win-2009-pg.gif]
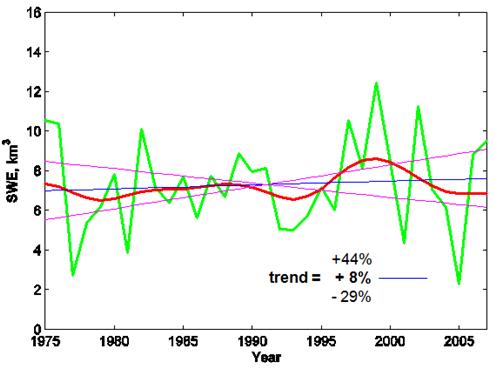
University of Washington researcher Mark Stoelinga has studied the Cascade snowpack and concludes “Snowpack trend since the ramp-up in global temperature in the 1970s is slightly positive” [ftp://ftp.atmos.washington.edu/stoeling/presentations/PNWWW_2008_Snowpack.ppt] The following figure from Stoelinga’s research shows the Snow Water Equivalent (SWE) for the Cascades from 1975 – 2007 (April data being designated as the critical timeframe for snowpack).
See: http://www.appinsys.com/GlobalWarming/RS_Washington_usa.htm#snowpack for more details about Cascade Mountain snowpack and precipitation in Washington State.
|
|
|
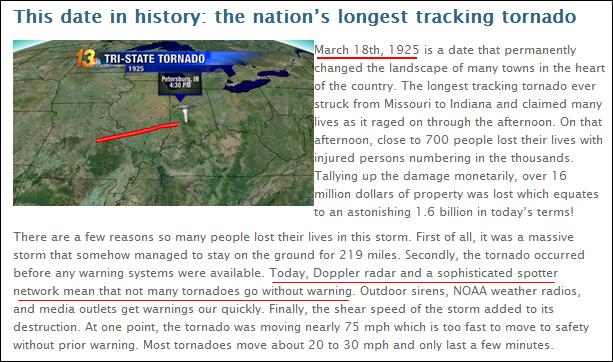
Tornadoes
|
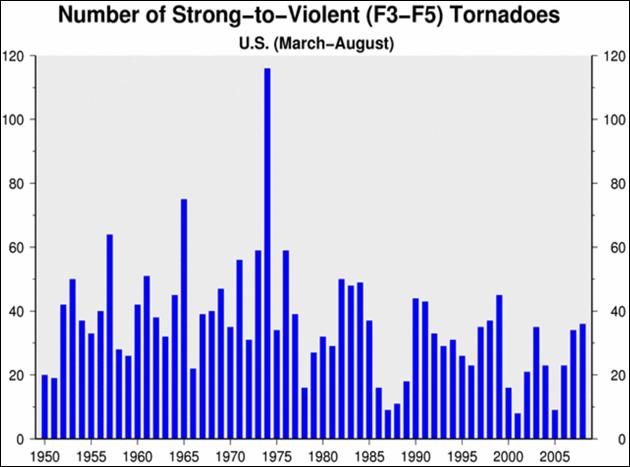
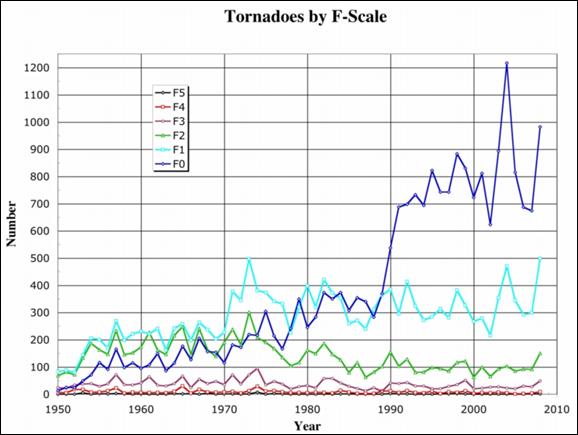
NOAA has reported the number of strong to violent (F3-F5) tornadoes each year in their annual climate summary report. The following graph is from 2008, showing a decline in strong tornadoes over the last 50 years.
[http://www.ncdc.noaa.gov/sotc/national/2008/ann]
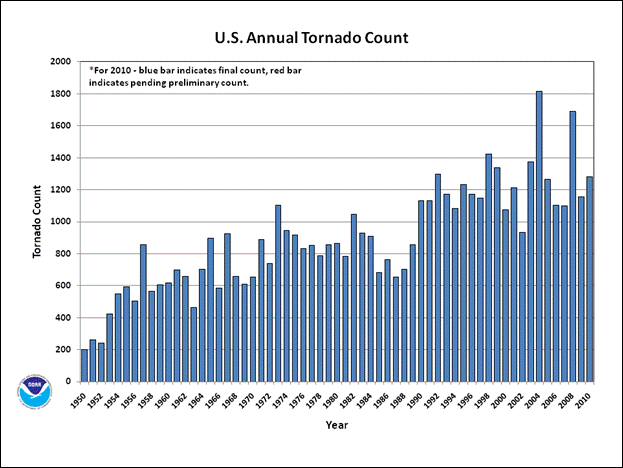
But in 2009, under Obama’s administration, the method of reporting tornadoes in the annual report changed so that the situation could suit the administrations goals. The following figure is from the 2010 report showing the tornado count, rather than the number of strong to violent tornadoes.
[http://www.ncdc.noaa.gov/sotc/national/2010/13]
The increasing tornado count is due to improved weather tracking technology. In the 1950s radar began to be used; then in the 1970s, Doppler radar improved the detection capabilities.
“"If you look at the past 60 years of data, the number of tornadoes is increasing significantly, but it's agreed upon by the tornado community that it's not a real increase," said Grady Dixon, assistant professor of meteorology and climatology at Mississippi State University. "It's having to do with better (weather tracking) technology, more population, the fact that the population is better educated and more aware. So we're seeing them more often," Dixon said. But he said it would be "a terrible mistake" to relate the up-tick to climate change. … However, the stronger-than-usual tornadoes affecting the southern states were actually predicted from examining the planet's climatological patterns, specifically those related to the La Nina phenomenon. "We knew it was going to be a big tornado year," he said. But the key to that tip-off was unrelated to climate change: "It is related to the natural fluctuations of the planet."” [http://www.physorg.com/news/2011-04-tornadoes-climate.html]
“A
top official at the National Oceanic and Atmospheric Administration (NOAA)
rejected claims by environmental activists that the outbreak of tornadoes
ravaging the American South is related to climate change brought on by global
warming. “There really is no scientific
consensus or connection [between global warming and tornadic activity]
….Jumping from a large-scale event like global warming to relatively
small-scale events like tornadoes is a huge leap across a variety of scales.”
Asked if climate change should be “acquitted” in a jury trial where it stood
charged with responsibility for tornadoes, Carbin replied: “I would say that
is the right verdict, yes.” Because there is no direct connection as yet
established between the two? “That’s correct,” Carbin replied.”
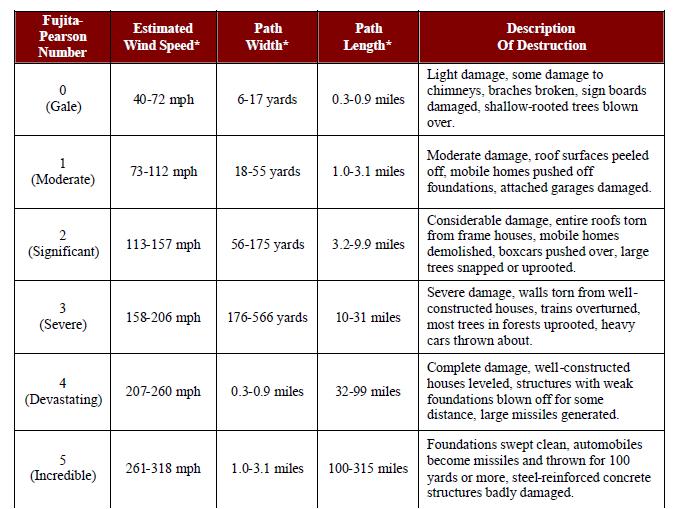
The Tornado F-scale:
[http://www.wildwildweather.com/united_states_tornado_history.pdf]
The number of F0 tornadoes reported has increased greatly as monitoring technology and reporting has improved. The number of strong tornadoes (F2-F5) has not increased, since these have been more accurately counted all along since 1950.
[http://www.flame.org/~cdoswell/Tornado_essay.html]
From August 1977 New Scientist: “In the 1970s, many improvements have been made in the efficiency of the [tornado] watch and warning service. Many more spotters are now available”
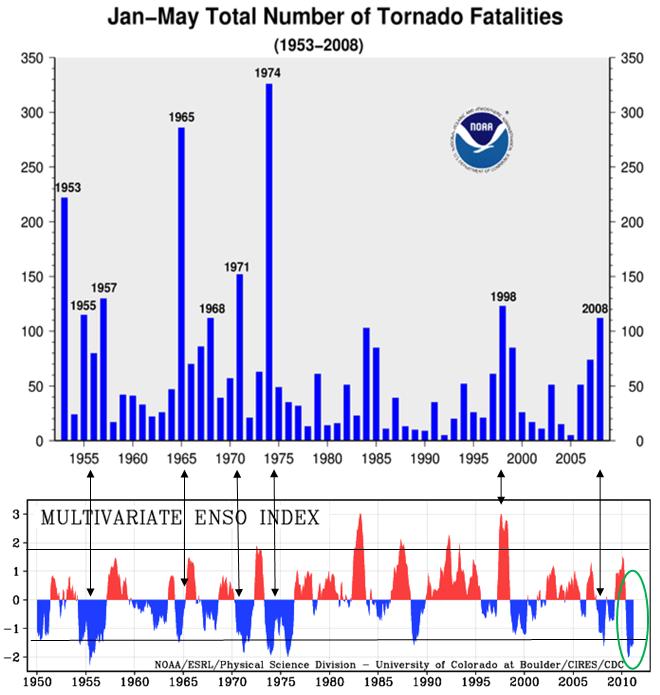
The following figure compares the tornado fatalities (from http://www.ncdc.noaa.gov/sotc/national/2008/ann]) as representative of very strong tornadoes, with the Multivariate El Nino Southern Oscillation Index (MEI – from [http://www.esrl.noaa.gov/psd/people/klaus.wolter/MEI/]).
It is clear that the years with violent tornadoes are years with extremes in the MEI – usually on the La Nina side of the ENSO. The tornadoes in 2011 also correspond to an extreme La Nina as indicated by the green circle above.
1999 study: “the findings show clear evidence of geographical shifts in tornado activity within the United States when comparing strong El Niño years to La Niña years,"” [http://jrscience.wcp.muohio.edu/studentresearch/climatechange02/tornado/articles/laninatornados.pdf] [http://www.sciencedaily.com/releases/1999/03/990301073453.htm]
See also: http://www.appinsys.com/GlobalWarming/TornadoLies.htm
|
 [
[
|
|
Storms
|
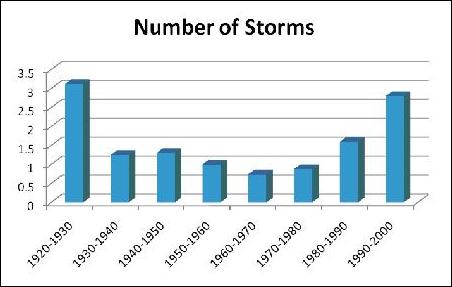
A 2009 study (Allan et al, “Fluctuations in autumn-winter severe storms over the British Isles: 1920 to present”, International Journal of Climatology, Vol.29) [http://www3.interscience.wiley.com/journal/121471830/abstract?CRETRY=1&SRETRY=0] states: “An examination of extreme storms across the British Isles over the last 85 years during the boreal autumn [October, November, December (OND)] and winter [January, February, March (JFM)] shows that large-scale natural climate variability plays an important role in modulating the intensity and frequency of these events.”
The following figure shows the history of October - March decadal average severe storm frequency over the British Isles from 1920 from the above study. [http://www.worldclimatereport.com/index.php/2009/12/27/winter-storms-update/#more-397]
The storminess of the 1990s is exceeded by the storminess of the 1920s.
|
|
|
River Flow
|
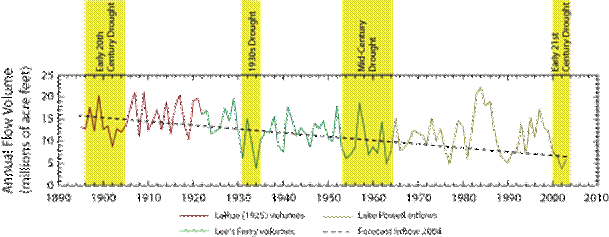
The following figure shows the Colorado River flow for the past 100 years [http://pubs.usgs.gov/fs/2004/3062/]. There has been continuous decline of the flow since the 1920s – obviously not a result of CO2.
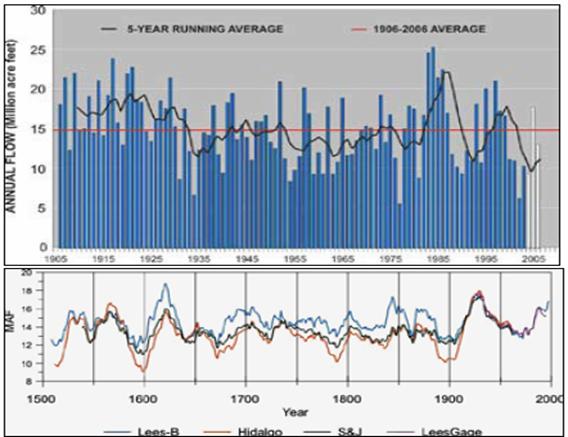
The following figures show Colorado River flow for 1905 – 2005 (top) and 1500 – 2000 (bottom) at Lees Ferry. [http://dels.nas.edu/dels/rpt_briefs/colorado_river_management_final.pdf] Putting the 20th century data in long term perspective shows that the river has gone through similar cycles in the past.
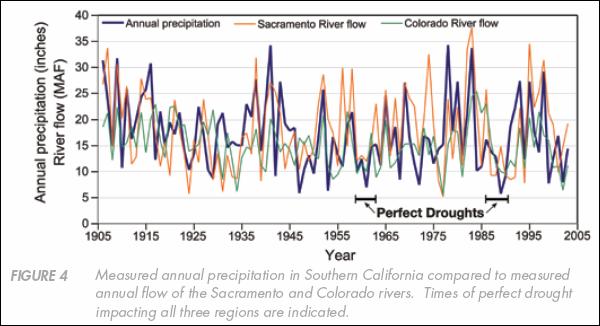
The following figure compares Colorado and Sacramento river flow with precipitation and shows periods of drought. [http://wwa.colorado.edu/colorado_river/docs/Colorado_River_Basin_Climate.pdf]
The above cited study states: “However, our instrumental records of precipitation and river flow extend back in time only 100 years or so. This time span is insufficient to capture the full range of natural variability in the climate of California and the west.”
Also: “Multi-century, tree-ring based reconstructions of Colorado River flow indicate that extended drought episodes are a recurrent and integral feature of the basin’s climate. Moreover, the range of natural variability present in the streamflow reconstructions reveals greater hydrologic variability than that reflected in the gaged record, particularly with regard to drought. These reconstructions, along with temperature trends and projections for the region, suggest that future droughts will recur and that they may exceed the severity of droughts of historical experience, such as the drought of the late 1990s and early 2000s.” [http://wwa.colorado.edu/treeflow/lees/final.html]
The Western Water Assessment states: “Does the now 100-year-long natural flow record capture the full range of natural variability of Colorado River streamflow? This seems unlikely” [http://wwa.colorado.edu/treeflow/lees/gage.html]
See: http://www.appinsys.com/GlobalWarming/ColoradoRiver.htm for more details
|
|
|
Wildfires
|
[updated: 2011/08/09]
Increased wildfires in recent years are often blamed on global warming. However, droughts occur in cycles and the forestry management practices have also resulted in increased fires.
A 2000 report to President Clinton stated: “As a result of the all-out effort to suppress fires, the annual acreage consumed by wildfires in the lower 48 states dropped from 40 to 50 million acres a year in the early 1930s to about 5 million acres in the 1970s. During this time, firefighting budgets rose dramatically and firefighting tactics and equipment became increasingly more sophisticated and effective. In short, decades of aggressive fire suppression have drastically changed the look and fire behavior of Western forests and rangelands. As a result, studies show that today’s wildfires typically burn hotter, faster, and higher than those of the past.” [http://www.fs.fed.us/emc/hfi/president.pdf]
A University of Arizona report stated: “devastating wildfires in recent years have been widely attributed to severe drought conditions, but other factors, such as sequences of wet and dry climatic conditions, fire suppression, logging, overgrazing, the actions of environmentalists, and an ongoing bark beetle infestation have also been blamed for playing significant roles. … At the heart of the problem is a century-long Forest Service policy of suppressing forest fires as soon as possible after they start, in an effort to prevent them from spreading… records from the 1930s—before such policies were enacted—show that during that decade a total of over 39 million acres burned; but in the 1970s, after fire suppression policies were fully implemented, only about a tenth as many acres burned. … Since the beneficial effects of fires have been curtailed, small trees are no longer thinned out. As a result, fuel loads in central Arizona are said to have increased by a factor of 9 over the last 100 years and similarly in New Mexico. This leads to fires that grow more quickly and burn with greater intensity.” [http://www.climas.arizona.edu/forecasts/articles/wildfire_April2003.pdf]
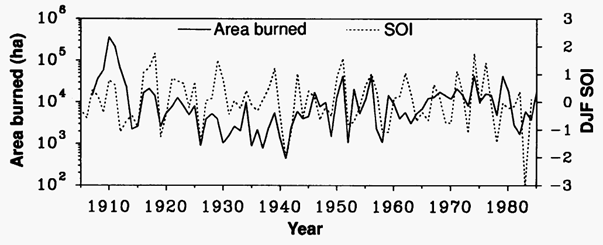
The following figure shows the correspondence of annual area burned in Arizona and New Mexico and the Southern Oscillation Index during December, January, and February (DJF). [http://oceanworld.tamu.edu/resources/oceanography-book/oceananddrought.html]
A2006 study (Kitzberger et al, “Contingent Pacific–Atlantic Ocean influence on multicentury wildfire synchrony over western North America” [http://www.pnas.org/content/104/2/543.full.pdf+html]) stated: “fires were most commonly synchronous across the West during warm phases of the AMO. ENSO and PDO were the main drivers of high-frequency variation in fire (interannual to decadal), whereas the AMO conditionally changed the strength and spatial influence of ENSO and PDO on wildfire occurrence at multidecadal scales. A current warming trend in AMO suggests that we may expect an increase in widespread, synchronous fires across the western U.S. in coming decades”
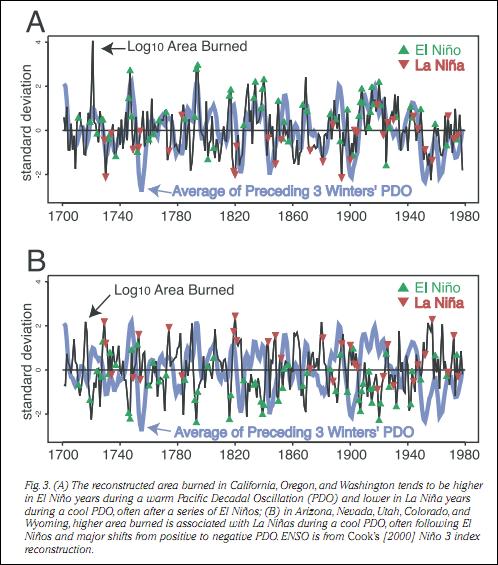
A 2003 study “Interannual to Decadal Drought and Wildfire in the Western United States” [http://ulmo.ucmerced.edu/pdffiles/03EOS_WesterlingSwetnam.pdf] states: “Twentieth-century wildfire suppression and land management policies have promoted biomass accumulations in some ecosystems in the western United States where wildfire is a natural and necessary element.These changes have fueled large,stand-replacing crown fires in southwestern ponderosa pine forests, where they were rare under natural fire regimes.” The following figure is from that study. The west coast area (figure 3 A) shows a very high correlation with the El Nino / La Nina events.
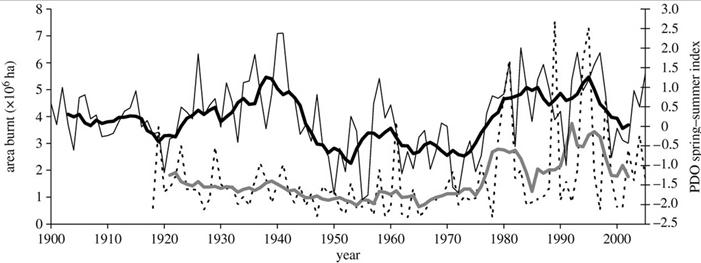
The following figure shows “forested area burned in Canada, 1918–2005 (dashed line); spring–summer PDO index, 1900–2005 (continuous line). Thick lines represent the 7-year running means in order to highlight low frequency variability (black, PDO; grey, area burned). Note the overall high similarity between both series at low frequencies.” [http://rstb.royalsocietypublishing.org/content/363/1501/2315.full]
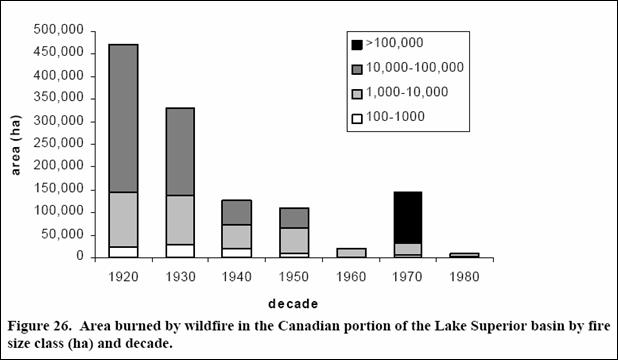
The following figure shows trends in forest fires in the Canadian portion of the Lake Superior basin. [http://www.epa.gov/glnpo/lakesuperior/2006/ls_chapter6_2006.pdf]
Huffington Post says “rising temperatures associated with climate change could result in many more severe forest fires in the coming decades. … Towards the end of the century, the average wildfire size is expected to exceed the largest from the current record year of 1988. … This new study comes at a time when nearly half of all Americans believe “the seriousness of global warming is exaggerated,” according to a Gallup Poll earlier this year.” [http://www.huffingtonpost.com/2011/07/27/climate-change-wildfires-link_n_910784.html]
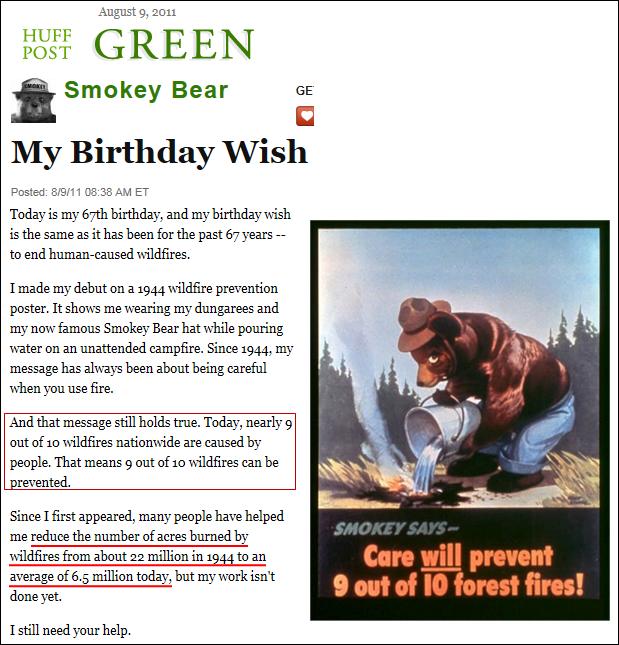
But, then again, as reported in Huffington Post a month later, the number of acres burned by wildfire has been reduced from “about 22 million in 1944 to an average of 6.5 million today”:
[http://www.huffingtonpost.com/smokey-bear/my-birthday-wish_b_921732.html]
|