Global Warming Summary series at www.appinsys.com/GlobalWarming
Climatic Events – Polar Ice Caps
[last update: 2009/06/21]
While the global temperature increase as instigated by the hockey stick graph got the global warming scare movement rolling, other climatic events such as hurricanes, glaciers, snow pack, precipitation and seal level rise have also garnered much alarmist attention.
Other documents in Climatic Events include:
- Hurricanes
- Precipitation (including Tornadoes)
- Glaciers
- Sea Level
- Animals (including Polar Bears)
- Human Disease / Death (including Malaria and Extreme Weather)
- North Atlantic Thermohaline Circulation / Gulf Stream
This document contains sections on:
|
|
Arctic / Antarctic Sea Ice Comparison
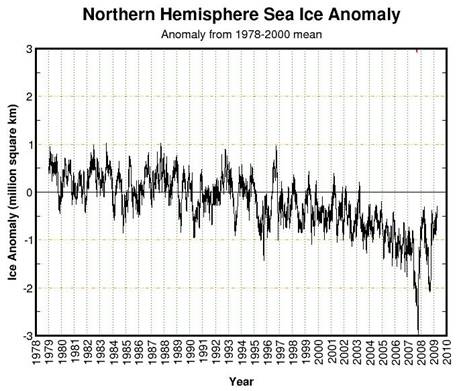
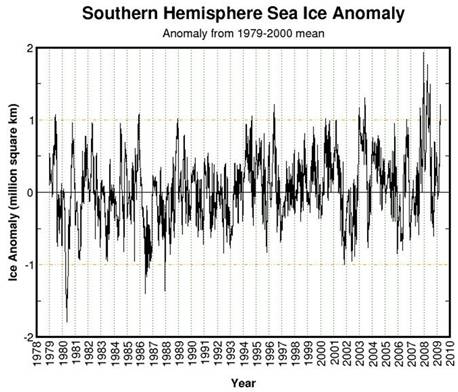
The ice extent in the Polar Regions has been measured since 1979 – the start of the satellite era for earth measurements. The following figures show sea ice extent anomalies for the Arctic (left) and Antarctic (right) to March 2009 [http://arctic.atmos.uiuc.edu/cryosphere/]
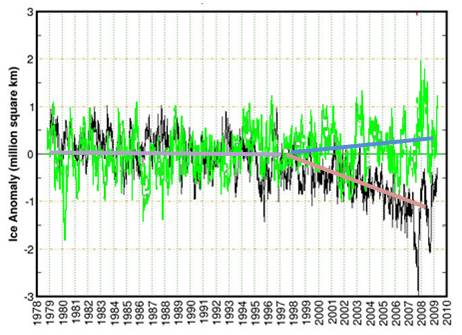
The following figure overlays the Antarctic ice anomalies (green) from above, on the Arctic ice anomalies (black) from above. A divergence began around 1998 (when the major El Nino of 1997-98 occurred). The divergence is due to divergence in sea surface temperature trends as shown later in this article.
The following figure shows the global sea ice extent anomalies to March 2009 [http://arctic.atmos.uiuc.edu/cryosphere/]. Arctic sea ice losses were balanced by Antarctic ice gains until around 2001-2 when Arctic losses started to exceed Antarctic gains (although as of March 2009, the global ice anomaly is positive – more ice than the 1979-2000 mean). Globally, sea ice cycles from a low of 15-16 million square km to a high of 22-23 million square km.
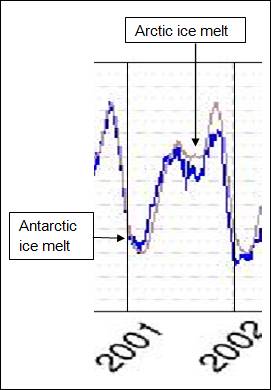
The following figure shows an annual cycle of global sea ice. The global minimum is reached in February when the Antarctic melt is at its maximum. The Arctic minimum occurs in September. The global maximum is reached in November as the Arctic ice re-grows.
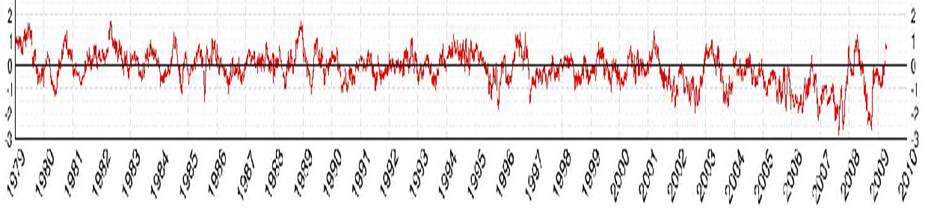
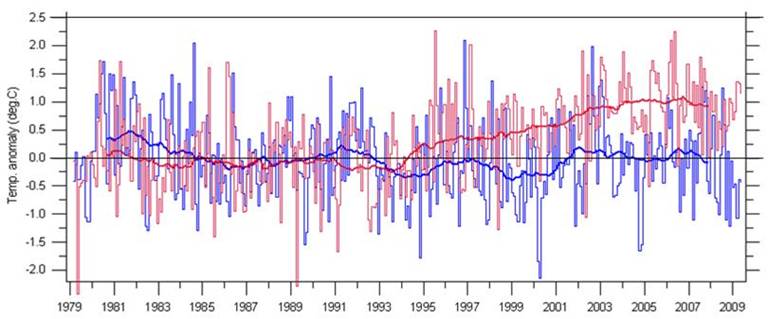
The following figure shows average Arctic temperature from the available satellite data (red) in comparison with the Antarctic (blue) [adapted from http://climate4you.com/]. Arctic – warming; Antarctic – not.
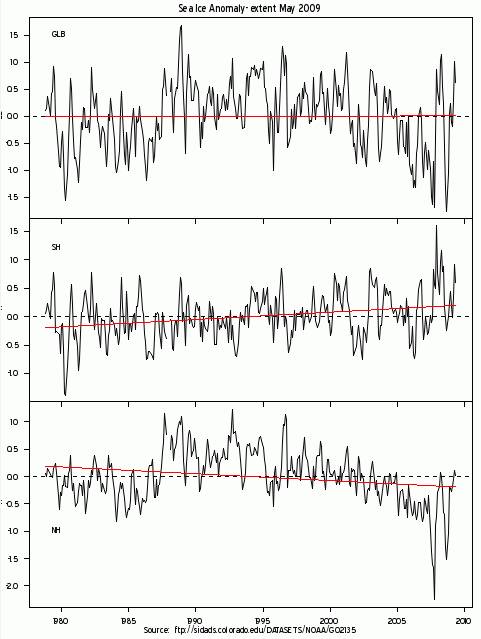
Steve McIntyre provides utilities for downloading the sea ice data directly from the sources so that individuals may plot it themselves [http://www.climateaudit.org/?p=6316]. The following graph is plotted by him and shows global (GLB), southern hemisphere (SH) and northern hemisphere (NH) sea ice extent anomalies to May 2009.
|
|
Arctic Sea Ice and Greenland Ice Sheet
Arctic sea ice has been declining in recent decades as shown in the following figures:
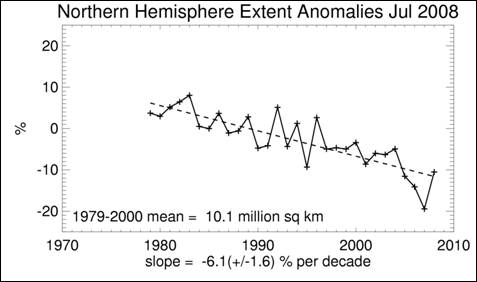
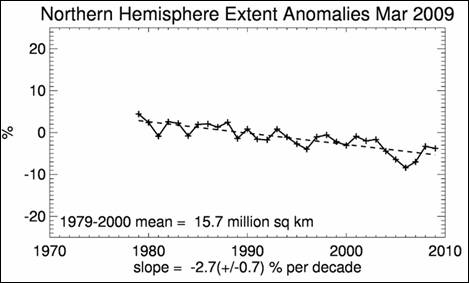
Arctic Sea Ice Extent Since 1979 [http://nsidc.org/data/seaice_index/]
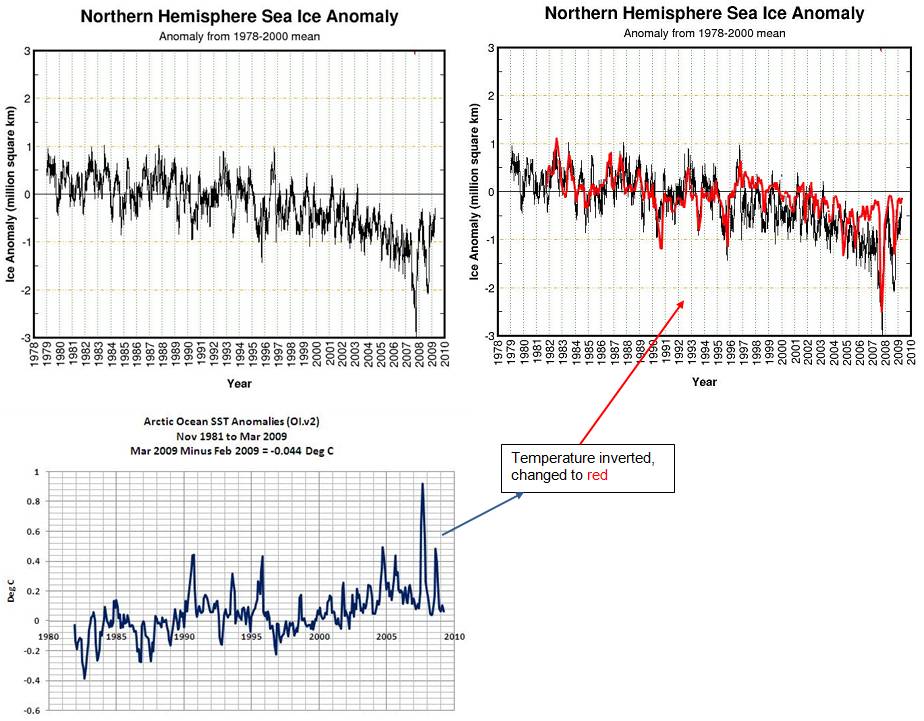
The following figures show sea ice extent anomalies for the Arctic (left) as of March 2009 [http://arctic.atmos.uiuc.edu/cryosphere/] and then (right) with Arctic Ocean sea surface temperatures [http://bobtisdale.blogspot.com/2009/04/march-2009-sst-anomaly-update.html] superimposed (inverted temperature).
Sea ice is ice that is in the ocean (and therefore does not contribute to sea level rise as it melts). The Greenland ice sheet is on land and thus its melting would contribute to sea level rise. The problem with most available data is the lack of a long-term perspective. To put this in a longer time-frame perspective, A study of climate trends in Greenland by University Geoscience researchers in Denmark and Norway "Meteorological trends (1991-2004) at Arctic Station, Central West Greenland (69º15’N) in a 130 years Perspective" [http://www.rdgs.dk/image/pub_pdf/artikler/2006_1/GT106_04_Hansen_Elberling_Humlum_Nielsen.pdf] concluded: "we conclude that markedly changes can be noted, including increasing mean annual air temperatures on the order of 0.4°C per year and 50% decrease in sea ice cover. Changes are mainly noted for the winter period, but also the summer period has been affected as increasing thawing depths and an increase in the growing season. When data are compared to other data series it becomes clear that meteorological observations at Arctic Station are in line with other longer records including data Ilulissat/Jakobshavn, which makes it possible to estimate data from Arctic Station back to 1873. Over this long time period, estimated winter temperatures correlate significantly with NAO and reveal that although the documented climate changes the last decade are dramatic, they are on the same order as changes that occurred between 1920 and 1930". The following figure shows the 1870 - 2004 temperature graph is from their study.
Greenland Temperature Trend 1870 - 2004
A paper by Jason Box et al (Box, J.E., D.H. Bromwich, B.A. Veenhuis, L-S Bai, J.C. Stroeve, J.C. Rogers, K. Steffen, T. Haran, S-H Wang, “Greenland Ice Sheet Surface Mass Balance Variability (1988-2004) From Calibrated Polar MM5 Output”, Journal of Climate, Vol. 19, No. 12) [http://polarmet.mps.ohio-state.edu/jbox/pubs/Box_et_al_J_Climate_2006.pdf] states “The combined effect of temperature and precipitation trends over the 17-yr lead to increased rates of ablation and increased accumulation (Fig. 10b). The net effect of these competing factors demonstrates that the overall (total ice sheet) surface mass balance change is relatively small”.
The following figures show the 17-year change in average annual surface mass balance for the Greenland ice sheet (left - Figure 10b referred to above) and the reconstructed runoff from the ice sheet from 1860 – 2004 (right). The mass balance figure indicates melting at some edges with increase in ice in the center. The runoff figure shows that the melting is similar to the 1930s.
See also:
Greenland: www.appinsys.com/GlobalWarming/RS_Greenland.htm
Arctic: www.appinsys.com/GlobalWarming/RS_Arctic.htm
Arctic Sea Ice 2007: http://www.appinsys.com/GlobalWarming/RS_ArcticIce_2007.htm
|
|
Antarctic Ice Sheet
The Antarctic ice sheet is massive and is situated on top of the land, thus the melting of it would significantly raise sea levels. Antarctica also has substantial sea ice shelves which, as sea ice do not contribute to sea level. Studies show that Antarctic is not warming. The ice sheet is melting at the edges where it is in contact with the ocean, which has been warming in some locations, but most of the ice sheet is gaining mass, more than balancing the loss at the edges.
The following figures show the Antarctic sea ice extent [http://nsidc.org/data/seaice_index/] showing a slight increase over the last few decades.
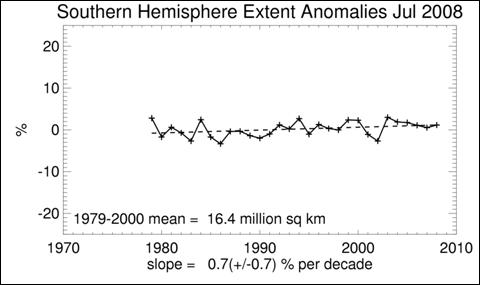
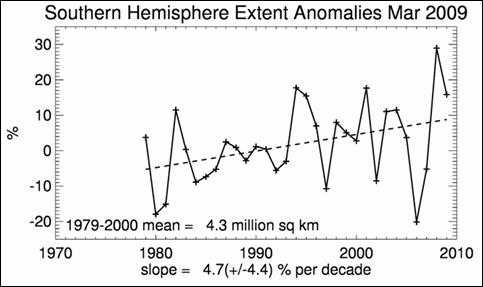
Antarctic Ice Extent Anomalies Since 1979
An article in Science Daily about a study reported in the Journal of Geophysical Research (Oceans) [http://www.sciencedaily.com/releases/2005/06/050630064726.htm] (“Warmer Air May Cause Increased Antarctic Sea Ice Cover”, 2005) that used satellite observations from NASA's Special Sensor Microwave/Imager to assess snow depth on sea ice. The article states that “increases in precipitation due to warmer air temperatures from greenhouse gas emissions may actually increase sea ice volume in the Antarctic's Southern Ocean. This finding from a new study adds evidence of potential asymmetry between the two poles and may be an indication that climate change processes may have varying impacts on different areas of the globe.”
An article in GeoTimes (“Confusion Corner: Antarctica”, 2002) documenting research by the National Science Foundation’s Long Term Ecological Research (LTER) team studying temperature changes [http://www.geotimes.org/mar02/NN_antarctica.html] in which Peter Doran led researchers “We found that over the past 35 years, more of the continent has been cooling than warming, and the cooling has been about 1 degree Fahrenheit decrease per decade in the Dry Valleys since 1986,” Doran says. While the Dry Valleys are cooling much faster than the rest of the continent, areas such as the Antarctic Peninsula are warming faster. The LTER scientists’ analysis indicates that overall, 58 percent of the continent is cooling. As Ian Joughin of NASA’s Jet Propulsion Laboratory and Slawek Tulaczyk of the University of California at Santa Cruz write in the Jan. 18 Science, part of the ice sheet has actually begun to thicken, not melt. Tulaczyk says: “Climate models need to be improved to explain cooling. They do not currently account for spatial or temporal variabilities such as cooling. And these new aspects of ice-sheet behavior need to be incorporated into glaciological models of ice-sheet flow.”
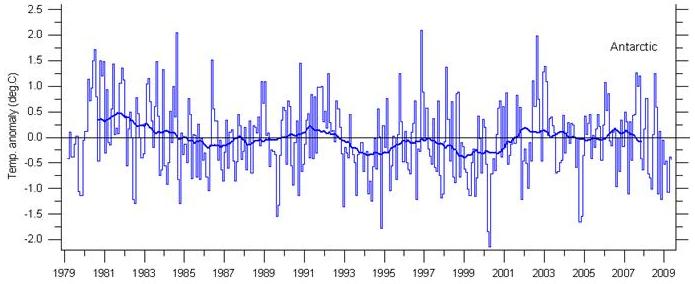
Satellite measurements (which started in 1979) show no warming in the Antarctic, as shown in the following figure (graph from http://climate4you.com/).
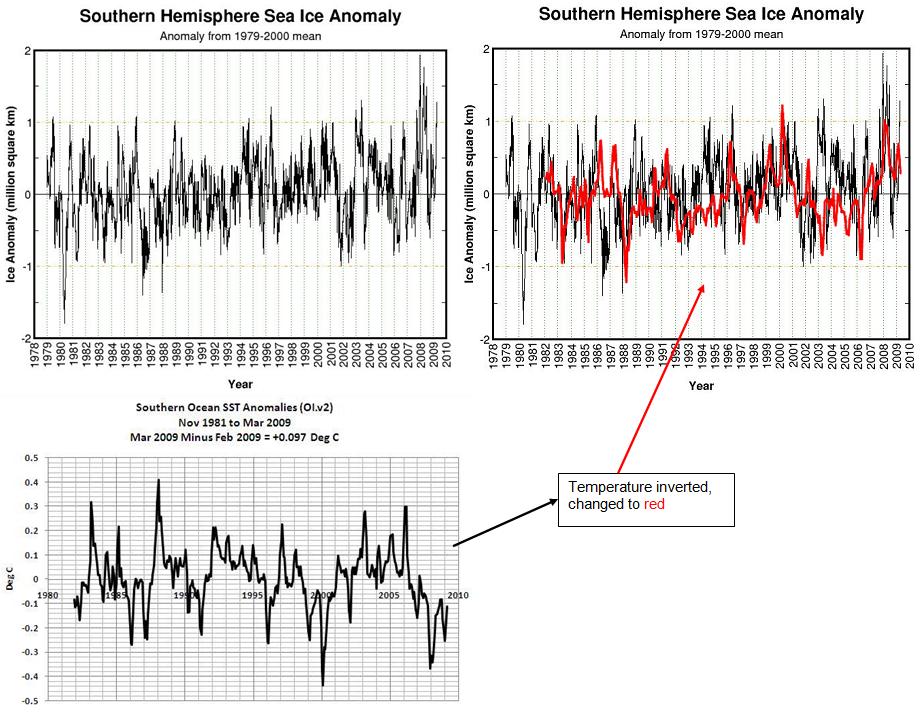
The following figures show sea ice extent anomalies for the Antarctic (left) as of March 2009 [http://arctic.atmos.uiuc.edu/cryosphere/] and then (right) with southern ocean (60S-90S) sea surface temperature anomalies [http://bobtisdale.blogspot.com/2009/04/march-2009-sst-anomaly-update.html] superimposed (inverted temperature).
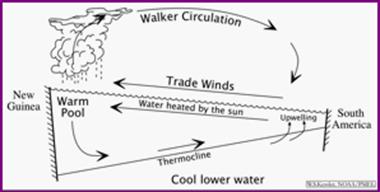
The El Nino Southern Oscillation phenomenon is related to the Pacific trade winds. The western Pacific is warmer than the eastern Pacific (the warm pool), as shown below (left) [http://faculty.washington.edu/kessler/occasionally-asked-questions.html#q1]. During El Nino the trade winds are weaker than “normal” allowing stronger ocean currents to flow eastward, while during La Nina the winds are stronger pushing stronger westward currents. The centroid of the western Pacific warm pool (WPWP) moves longitudinally as shown below (right) [http://www.shao.ac.cn/yhzhou/ZhouYH_2004JG_PM_Warmpool.pdf]. The major El Nino events of 1983 and 1998 caused the WPWP centroid to move as far east as 170W.
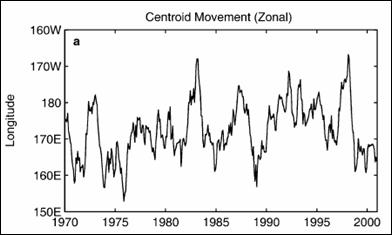
The following figure shows the WPWP centroid movement from above right, inverted, changed to red and lagged by four years, compared with the Antarctic sea ice anomaly. The good correlation, especially for the major El Nino events of 1983 and 1998, indicate that warmer water is pushed by the WPWP to cause ice retreat in Antarctica and that it takes four years for the warmer water to reach Antarctica.
See also:
Antarctica: www.appinsys.com/GlobalWarming/RS_Antarctica.htm
Antarctic Peninsula: www.appinsys.com/GlobalWarming/RS_AntarcticPeninsula.htm
Wilkins Ice Shelf: www.appinsys.com/GlobalWarming/AntarcticWilkinsIceShelf.htm
Regularly updated sea ice data: www.Climate4You/SeaIce.htm