Global Warming Science - www.appinsys.com/GlobalWarming
Climatic Events – Glaciers
[last update: 2011/04/16]
While the global warming scare got rolling, other climatic events such as receding glaciers have also garnered much alarmist attention.
Glaciers are the focus of this document.
Other documents in this Climatic Events series include:
- Hurricanes
- Precipitation (including Tornadoes)
- Polar Ice Caps
- Sea Level
- Animals (including Polar Bears)
- Human Disease / Death (including Malaria and Extreme Weather)
- North Atlantic Thermohaline Circulation / Gulf Stream
|
|
Glaciers
|
An article in Science Daily (“Southern Glaciers Grow Out of Step with North” [http://www.sciencedaily.com/releases/2009/04/090430144535.htm]) states: “Overall, glaciers around the world have been declining since about 1860, with the exception of a brief advance in Switzerland in the 1980s, New Zealand in the late 1970s through today, and a few other places.”
Most glaciers around the world (alpine and Greenland ice-sheet glaciers) have been melting as part of the long-term warming trend since the end of the Little Ice Age in the 1700s (although some are actually increasing). The recession of glaciers started long before anthropogenic CO2 levels rose. Since the IPCC says that anthropogenic CO2-based warming has only had an effect since the 1970s (see: www.appinsys.com/GlobalWarming/gw_nutshell.htm), the recession of glaciers cannot be due to anthropogenic CO2-based global warming. In fact many non-alps glaciers have either been increasing, or have had a decrease in the rate of retreat in recent decades.
A book published in 1926 (C.E.P.Brooks: “Climate Through the Ages”) stated: “the period from 1600 to 1850 has been termed the "Little Ice-Age." There were minor maxima of glaciation about 1820 and 1850; since then the glaciers and ice-sheets have been in rapid retreat in all parts of the world.” [http://www.archive.org/details/climatethrouchth033039mbp]
When examining claims made about glaciers, it is important to have historical data back to at least the early 1900s – otherwise the information is out of context for a climatic assessment. Statements about changes over the last few decades are meaningless without a longer term context.
|
|
This document has sections on:
|
|
|
|
[2010/01/17]: World misled over Himalayan glacier meltdown [http://www.timesonline.co.uk/tol/news/environment/article6991177.ece]
|
|
|
|
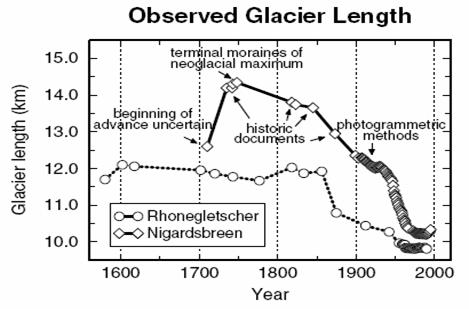
The following figures are from a study of 169 receding glaciers worldwide (Johannes Oerlemans, “Extracting a Climate Signal from 169 Glacier Records”, published in Science, 2005). The first figure shows relative glacier length for five glaciers, two of which have data back to the 1700s. (Figure from [http://www.dartmouth.edu/~mpayres/hhs/EarthDay_Talk.pdf]) The second figure shows the composite average of up to 169 glaciers (the number varies in different time periods). (Figure from [http://www.searchanddiscovery.net/documents/2008/08068cuffey/cuffey.pdf] - The PDF source states that the glacier “data also reveal connections between climate and solar variability”.)
These figures indicate the pattern that is consistent for most glaciers worldwide – the recession of the glaciers started at the end of the Little Ice Age: “The coldest time was during the 16th and 17th Centuries. By 1850 the climate began to warm.” [http://www.windows.ucar.edu/tour/link=/earth/climate/little_ice_age.html]
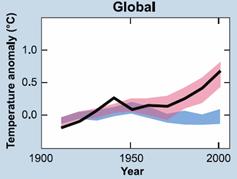
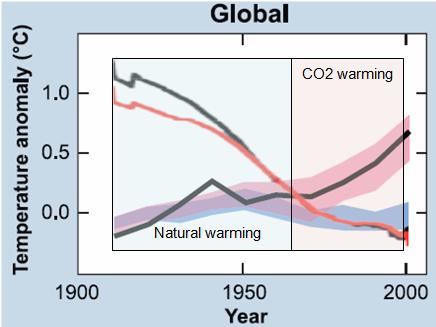
The following figure shows the IPCC graph of model outputs (left) (from IPCC 2007 AR4 Figure SPM-4 [http://www.ipcc.ch/pdf/assessment-report/ar4/syr/ar4_syr_spm.pdf]) In this figure, the blue shaded bands show the result of climate model simulations using only the natural forcings, while red shaded bands show the result of climate model simulations including anthropogenic CO2. This clearly shows that prior to about 1970, the global warming is fully explained by climate models using only natural forcings (i.e. no human CO2). The figure on the right superimposes the receding glacier trend from above on the SPM-4 figure. Glaciers have been receding since the Little Ice Age and cannot be attributed to CO2. If anything the rate of global glacier recession since 1970 has declined.
|
|
|
|
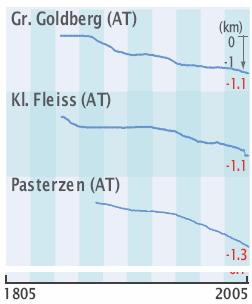
The following figures show glacier recession for several glaciers in the Austrian Alps (left) and French Alps (right) [http://www.grid.unep.ch/glaciers/pdfs/6_5.pdf] showing fluctuating glacial retreat since the 1800s.
The following figure shows the number of advancing glaciers (blue) and retreating glaciers (red) for Central Europe [http://www.grid.unep.ch/glaciers/pdfs/5.pdf]. The figure refers to the Little Ice Age maximum glacier extents in the mid-1800s.
The following figures show the retreat of the Mer de Glace glacier in the Alps. The rate of retreat accelerated in the mid-1800s. [http://people.iarc.uaf.edu/~sakasofu/pdf/two_natural_components_recent_climate_change.pdf]
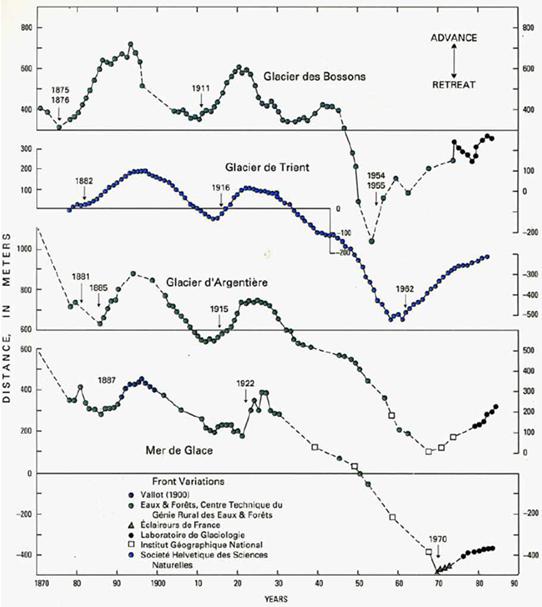
The following figure shows the change in length of four glaciers on Mt Blanc in the French Alps from 1870 to 1990 [http://pubs.usgs.gov/pp/p1386e/alps.pdf]. There was an overall declining trend throughout most of the period until 1960-70 when the glaciers started increasing.
Austria:
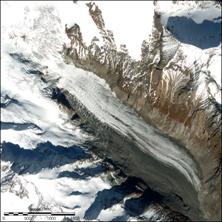
[http://earthobservatory.nasa.gov/IOTD/view.php?id=4549] (The Pasterze is Austria’s largest glacier.)
“There has been a general recession of glaciers in the European Alps since the Little Ice Age ended around 1850, though the recession has been interrupted a few times by brief advances. The glaciers are receding in response to a regional climate warming.” [http://www.easternsnow.org/proceedings/2001/Hall_1.pdf]
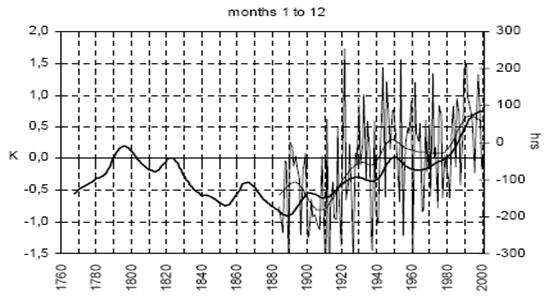
The following figure shows why temperatures have been increasing in Austria – increased sunshine over the 20th century. The solid thick line is temperature anomaly since 1765 (left scale) and the thin line is the hours of bright sunshine at high elevation (right scale) (from “Austrian Long-Term Climate 1767-2000”, Auer, Bohm & Schoner, Zentralanstalt für Meteorologie und Geodynamik, 2001 [http://www.zamg.ac.at/histalp/downloads/abstract/Auer-etal-2001b-F.pdf])
Switzerland
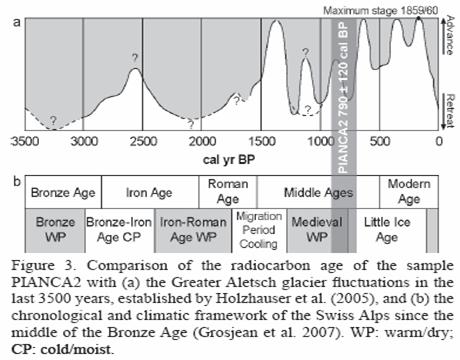
Tree remains are being uncovered by receding glaciers – indicating that it was warmer when the trees grew there. The Aletsch glacier’s current retreat began in 1860 – before the CO2 era. And it has been smaller before. [http://my.unil.ch/serval/document/BIB_CABCAD6ABFA7.pdf]
“Based on geomorphological, climatological and geophysical observations, we infer that (1) the treeline in the Medieval Warm Period was about 200 m higher than in the middle of the 20th century, which corresponds to a mean summer temperature as much as 1.2°C warmer than in AD 1950” [http://www3.interscience.wiley.com/journal/123207373/abstract]
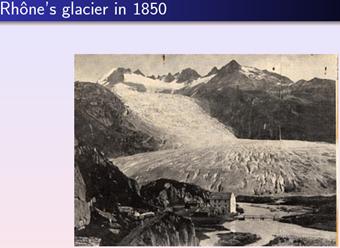
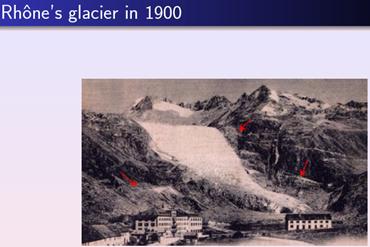
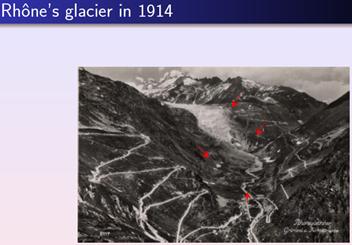
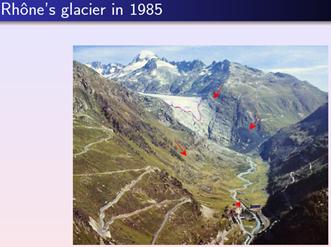
Rhone Glacier
The Rhone Glacier feeds the Rhone River. The following sequence of images show that the glacier has been receding since the mid 1800s when observations began to be recorded. The change from 1914 to 1985 is much less than in the late 1800s [http://cermics.enpc.fr/~lelievre/Workshop_Complex_Fluid/MP.pdf].
Nigardsbreen (Norway) and Rhonegletscher (Switzerland):
[http://www.mpimet.mpg.de/fileadmin/publikationen/Ex72.pdf]
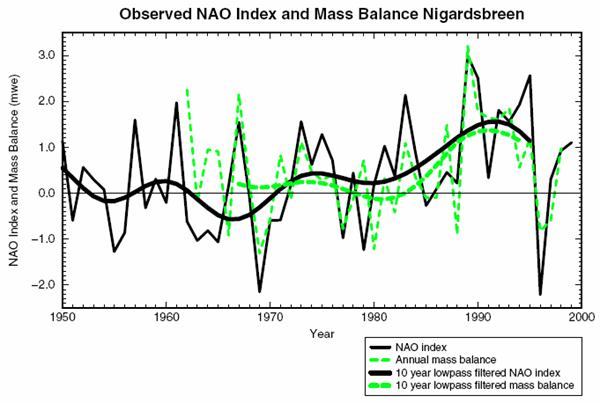
A study of “Midlatitude Forcing Mechanisms for Glacier Mass Balance” (Reichert, Bengtsson and Oerlemans, Journal of Climate, 2000) [http://www.mpimet.mpg.de/fileadmin/publikationen/Ex72.pdf] states: “The observed strong positive glacier mass balances within 1980-1995 can thus be seen as a consequence of the corresponding observed persistent positive phase of the NAO within this time period. This mechanism will probably also be valid for other maritime Norwegian glaciers which have also shown strong positive mass balances within this period [IASH, 1999].”
The following figure shows the correlation between the NAO index (black) and the Nigardsbreen Glacier (Norway) mass balance (green).
The same study concludes: “Glacier mass balances of Alpine glaciers have been strongly negative during the decade 1980-1990. The average mass balance value has been -0.65 mwe [Haeberli et al., 1999] resulting in an estimated loss of 10 to 20% of ice volume since 1980 [Haeberli and Beniston, 1998]. The results of the present study indicate that this loss of mass balance can (at least as has been demonstrated for Rhonegletscher) partly be explained by the strong positive phase of the NAO within this time period.”
(See: http://www.appinsys.com/GlobalWarming/AO_NAO.htm for more information on the NAO)
|
|
|
|
The Mount Kilimanjaro glacier has been touted as an effect of anthropogenic global warming. The disappearing glacier is due to solar effects. In fact the Mount Kilimanjaro glaciers mainly sublimate directly to the atmosphere, rather than melting into runoff water.
A 2010 study reported in New Scientist (“Kilimanjaro’s vanishing ice due to tree felling”, [http://www.newscientist.com/article/mg20727794.400-kilimanjaros-vanishing-ice-due-to-treefelling.html]) states: “the air at the summit is getting drier, reducing the snowfall that replenishes the ice and reflects solar radiation. Now Nicholas Pepin from the University of Portsmouth, UK, and colleagues say deforestation could be an important part of the puzzle. Between September 2004 and July 2008, the team took hourly humidity and temperature readings at 10 elevations on the mountain. These revealed that daytime heating generates a flow of warm, moist air up the mountainside. Trees play an important role here by providing moisture through transpiration. Pepin suggests that extensive local deforestation in recent decades has likely reduced this flow of moisture, depleting the mountain's icy hood.”
A 2006 study of Mount Kilimanjaro: “Kilimanjaro Glaciers: Recent Areal Extent From Satellite Data and New Interpretation of Observed 20th Century Retreat Rates” by Cullen, Molg, Kaser, Hussein, Steffen, and Hardy (Tropical Glaciology Group, Department of Earth and Atmospheric Sciences, University of Innsbruck, Austria; Cooperative Institute for Research in Environmental Sciences, University of Colorado, and Climate System Research Center, Department of Geosciences, University of Massachusetts) (Geophysical Research Letters, 2006) states: “All ice bodies on Kilimanjaro have retreated drastically between 1912–2003. Despite air temperatures always being below freezing, areal retreat of plateau glaciers is governed mostly by solar radiation induced melt on vertical walls that characterize their north and south margins [Mölg et al., 2003]. Though the processes responsible for the formation of the vertical walls is still not well understood, once established, the vertical wall retreat is irreversible, and no change in 20th century climate appears to have significantly altered their ongoing demise. ... Rather than changes in 20th century climate being responsible for their demise, glaciers on Kilimanjaro appear to be remnants of a past climate that was once able to sustain them. Hastenrath [2001, 2006] suggests an increase in net shortwave radiation, accompanied by a decrease in cloudiness and precipitation, initiated the retreat of the glaciers during the last two decades of the 19th century. This is supported by a recent finding that a higher frequency of climatically significant Indian Ocean Zonal Mode events in the 19th century (1820–1880) may have provided a mechanism to contribute to a wetter climate in East Africa, and thus stable glaciers.“
In another paper “Modern Glacier Retreat on Kilimanjaro as Evidence of Climate Change: Observations and Facts” by Kaser, Hardy, Molg, Bradley and Hyera (Tropical Glaciology Group, Department of Geography, University of Innsbruck, Austria, Climate System Research Center, Department of Geosciences, University of Massachusetts, and Tanzania Meteorological Agency) (International Journal of Climatology, 2004) [http://www.geo.umass.edu/faculty/bradley/kaser2004.pdf] the researchers state: “From a hydrological point of view, meltwater from Kibo’s glaciers has been of little importance to the lowlands in modern times… Most glacier ablation is due to sublimation, and where ice does melt it immediately evaporates into the atmosphere… The scenario presented offers a concept that implies climatological processes other than increased air temperature govern glacier retreat on Kilimanjaro in a direct manner.” The following figure is from this paper, showing the decrease in glacier extents going back at least as far as the late 1800s.
Reduction of African Glacier Areas over the Last Century
An article in the American Scientist (“The Shrinking Glaciers of Kilimanjaro: Can Global Warming Be Blamed” by Philip Mote and Georg Kaser, July-August 2007) blames a decrease in precipitation and an increase in sublimation. The following figure shows the temperature trend for 1958 – 2006 for the Kilimanjaro summit altitude from “reanalysis” of weather-balloon readings. The authors describe the physical features of the glaciers (penitents, vertical walls, etc.) indicating that melting is not causing the disappearance.
Research by Britain’s Portsmouth University indicated the decline of Mt. Kilimanjaro glaciers is: “caused more by local than regional factors. Pepin believes that deforestation which is mainly due to extensive farming is the major cause. … Deforestation of the mountain`s foothills is the most likely culprit because without forests there is too much evaporation of humidity into outer space. The result is that moisture-laden winds blowing across those forests have become drier and drier.” [http://216.69.164.44/ipp/guardian/2008/09/05/121966.html]
Hastenrath, 2009: “Climatic forcing of glacier thinning on the mountains of equatorial East Africa” “For the summit of Kilimanjaro, above the mean freezing level, where ablation is limited to sublimation, turbulent heat transfer processes associated with temperature differences cannot account for the imbalance of the mass budget, and solar radiation forcing continues to be important for both the ice thinning and the lateral retreat of ice cliffs.” [http://onlinelibrary.wiley.com/doi/10.1002/joc.1866/abstract]
For further details on Mount Kilimanjaro, see also the Regional Summary on East Africa at www.appinsys.com/GlobalWarming/RS_EastAfrica.htm.
Rwenzori Mountains, Uganda
Although not as famous as Mt Kilimanjaro, the nearby Rwenzori mountains exhibit similar glacier recession.
A 2003 study, Molg et al “THE CONTRIBUTION OF INCREASED INCOMING SHORTWAVE RADIATION TO THE RETREAT OF THE RWENZORI GLACIERS, EAST AFRICA, DURING THE 20TH CENTURY”, International Journal of Climatology states: “Complex retreat patterns of the glaciers in the Rwenzori Range, which are particularly obvious on the single glaciers Speke and Moore, evoked — in connection with the information on an abrupt change to drier conditions in East Africa around 1880 — the hypothesis of increased incoming shortwave radiation due to a change in the diurnal cycle of convective cloudiness. … The results confirm the hypothesis of increased incoming shortwave radiation as the reason for the complex and spatially differential glacier retreat in the Rwenzori mountains. In the context of modern climate fluctuations, the results of this study support the findings of Kruss (1983, 1984), Hastenrath (1984, 2001), Nicholson et al. (2000), and Nicholson and Yin (2001); a climatic change in East Africa was concentrated at the end of the 19th century, leaving a humid regime behind and leading to a relatively dry regime, which is forcing the recession of glaciers not only by less accumulation but also — as made clear in this paper — by less protection against shortwave radiation through clouds. A steadily increasing air temperature cannot hold for the spatial differences.” [http://www.uibk.ac.at/geographie/tropical-glaciology/literatur/moelggeorgeskaser03.pdf]
|
|
|
|
Glacier National Park, Montana, USA
A 2006 paper by scientists at Montana State University and the U.S. Geological Survey (Pederson, G.T., S.T. Gray, D,B. Fagre, and L.J. Graumlich. 2006. “Long-Duration Drought Variability and Impacts on Ecosystem Services: A Case Study from Glacier National Park, Montana”. Earth Interactions, 10, Paper No. 4.) and provides the following figure showing the decreasing area of the Sperry Glacier over the available timeframe of observations (left). The graph (right) shows the glacier area versus year.
Another study “Decadal-scale Climate Drivers for Glacial Dynamics in Glacier National Park, Montana, USA” (Pederson, G. T., D. B. Fagre, S. T. Gray, and L. J. Graumlich (2004), Geophysics Research Letters) [http://www.agu.org/pubs/crossref/2004/2004GL019770.shtml] “the 1850's glacial maximum was likely produced by ∼70 yrs of cool/wet summers coupled with high snowpack. Post 1850, glacial retreat coincides with an extended period (>50 yr) of summer drought and low snowpack culminating in the exceptional events of 1917 to 1941 when retreat rates for some glaciers exceeded 100 m/yr. This research highlights potential local and ocean-based drivers of glacial dynamics, and difficulties in separating the effects of global climate change from regional expressions of decadal-scale climate variability.”
See also the regional summary on western Montana at www.appinsys.com/GlobalWarming/RS_Montana_usa.htm for information on Glacier National Park (while temperatures have not been warming, the glaciers have been receding since the 1800s).
Mount Rainier National Park, Washington, USA
The following figure shows the Nisqually Glacier on Mount Rainier in Washington State, USA. The left-hand figure shows the reduction of the glacier from the early 1800s to 1997 (corresponding to the graph in the lower-right). The upper right graph shows the temperature trend from 1910 to 2007 for the closest temperature station at Longmire.
|
|
|
|
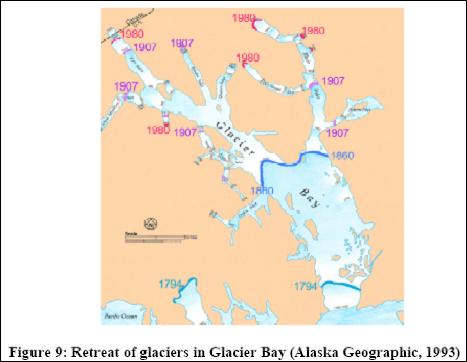
A 2007 paper by Syun-Ichi Akasofu at the International Arctic Research Center (University of Alaska Fairbanks) provides an analysis of warming trends in the Arctic. [http://www.iarc.uaf.edu/highlights/2007/akasofu_3_07/index.php ] The authors analyzed various climate-related trends in the Arctic, including the contraction of sea ice and glaciers (shown in the following figure): “Figure 8 shows that the southern edge of sea ice in the Norwegian Sea has been continuously receding from about 1800. Figure 9 shows examples of glaciers in Greenland and Alaska, which have been receding from the time of the earliest records (about 1800 for Greenland and 1900 for Alaska). There are a large number of similar records from the European Alps and elsewhere (Grove, 1982). Therefore, it can be assumed that many glaciers advanced during the Little Ice Age and have been receding since then. Thus, the retreat is not something that happened only in recent years.”
The authors’ conclusions: “The fact that an almost linear change has been progressing, without a distinct change of slope, from as early as 1800 or even earlier (about 1660, even before the Industrial Revolution), suggests that the linear change is natural change”
See also the Regional Summary on Alaska at www.appinsys.com/GlobalWarming/RS_Alaska.htm.
Glacier Retreat in Glacier Bay [from Akasofu]
Unlike most alpine glaciers, which have been retreating recently, the Hubbard Glacier near Yakutat Alaska “has been thickening and advancing toward the Gulf of Alaska since it was first mapped by the International Boundary Commission in 1895” [http://ak.water.usgs.gov/glaciology/hubbard/] “Hubbard Glacier is the largest of eight calving glaciers in Alaska that are currently increasing in total mass and advancing.”
The following figure shows the advance of the glacier over the last 100 years [http://pubs.usgs.gov/fs/fs-001-03/].
A study by Trabant et al (“The Slow Advance of a Calving Glacier: Hubbard Glacier, Alaska”, Annals of Geology, Vol 36, 2003) states: “the lower regions of the glacier have thickened by as much as 83 m in the last 41 years, while the entire glacier increased in volume by 14.1 cubic km. Ice speeds are generally decreasing near the calving face.”
See also: http://www.appinsys.com/GlobalWarming/HubbardGlacier.htm.
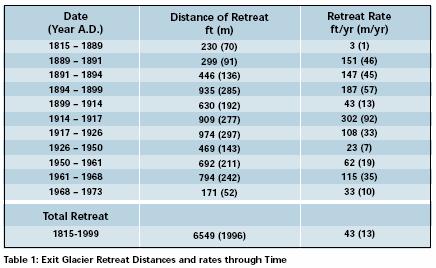
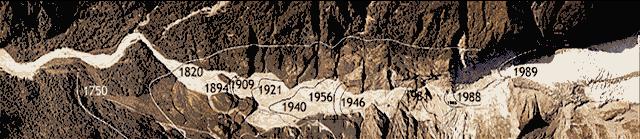
Exit Glacier, Kenai Fjords National Park, Alaska
“Exit Glacier is one of 38 glaciers that flow out from the Harding Icefield. During the early nineteenth century, the glacier almost reached the Resurrection River, approximately 1.25 miles (2 km) below its present location. … The Little Ice Age (LIA) was a time of global cooling from approximately 1350 to 1870 AD. During this time glaciers expanded in the northern regions, … With the warming trend of the 1800s, Exit Glacier began to retreat from its 1815 maximum.” [http://www.nps.gov/kefj/naturescience/upload/The%20Retreat%20of%20Exit%20Glacier.pdf]
The following table shows the glacier retreat rate (from the above reference).
|
|
|
|
New Zealand’s main glaciers – the Franz Josef and Fox glaciers have been advancing since the mid-1980s. The following two figures show the retreat of the Franz Josef glacier – the first showing the glacier front in various years and the second showing the rates of advance and retreat over the years. [http://pubs.usgs.gov/pp/p1386h/nzealand/nzfig13.html]
A 1999 study of NZ’s glaciers (“New Zealand glacier response to climate change of the past 2 decades”, T.J. Chinn) [http://www.sciencedirect.com/science?_ob=ArticleURL&_udi=B6VF0-3YHWS3C-G&_user=10&_rdoc=1&_fmt=&_orig=search&_sort=d&view=c&_acct=C000050221&_version=1 &_urlVersion=0&_userid=10&md5=bbbe432f07a9aad52520ede80089f16c] states: “Oblique aerial photography of 111 glaciers during the past 2 decades has recorded a reversal of the past century glacier-recession trend. Cirque glaciers show little response to the recent mass balance increase; mountain glaciers show visible advances. Some valley glaciers have advanced, some have thickened in the upper trunk, and the larger ones and those with proglacial lakes continue to recede. The shift to advance is driven by an average lowering of snowlines of 67 m, equivalent to a cooling of 0.47°C if other factors are held constant.”
An article in Science Daily (“Southern Glaciers Grow Out of Step with North” [http://www.sciencedaily.com/releases/2009/04/090430144535.htm]) states: “A new study in the journal Science puts this enigma in perspective; for the last 7,000 years New Zealand’s largest glaciers have often moved out of step with glaciers in the northern hemisphere, pointing to strong regional variations in climate. Conventional wisdom holds that climate during the era of human civilization has been relatively stable, but the new study is the latest to challenge this view, by showing that New Zealand's glaciers have gone through rapid periods of growth and decline during the current interglacial period known as the Holocene”
|
|
|
|
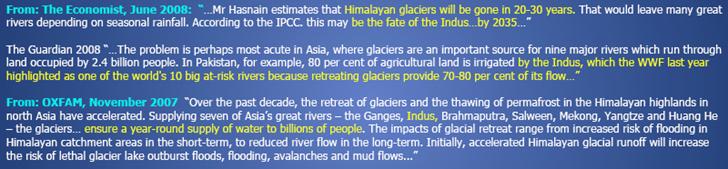
[2010/06/11]: Global warming's impact on Asia's rivers overblown [http://www.nature.com/news/2010/100610/full/news.2010.292.html?s=news_rss] “Although global warming is expected to shrink glaciers in the Himalayas and other high mountains in Central Asia, the declining ice will have less overall impact on the region's water supplies than previously believed … the Intergovernmental Panel on Climate Change had previously predicted dire restrictions on water supplies in Asia. "There clearly were some misunderstandings"”
[2010/01/17]: World misled over Himalayan glacier meltdown [http://www.timesonline.co.uk/tol/news/environment/article6991177.ece]
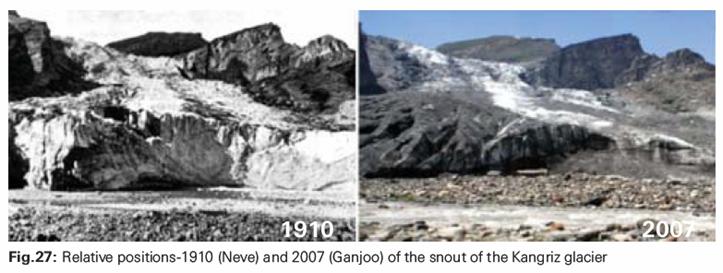
A 2009 Indian Ministry of Environment and Forests report: “Himalayan Glaciers: A State-of-Art Review of Glacial Studies, Glacial Retreat and Climate Change” [http://moef.nic.in/downloads/public-information/MoEF%20Discussion%20Paper%20_him.pdf] states: “Glaciers in the Himalayas, over a period of the last 100 years, behave in contrasting ways. As an example, Sonapani glacier has retreated by about 500m during the last one hundred years. On the other hand, Kangriz glacier has practically not retreated even an inch in the same period. Siachen glacier is believed to have shown an advance of about 700m between 1862 and 1909, followed by an equally rapid retreat of around 400m between 1929 and 1958, and hardly any retreat during the last 50 years. Gangotri glacier, which had hitherto been showing a rather rapid retreat, along its glacier front, at an average of around 20m per year till up to 2000 AD, has since slowed down considerably, and between September 2007 and June 2009 is practically at a standstill5. The same is true of the Bhagirathkharak and Zemu glaciers.”
The report concludes: “Glaciers in the Himalayas (India) have been exhibiting a continuous secular retreat since the earliest recording began around the middle of the nineteenth century. … Average annual retreat of the glaciers, under observation, which generally was around 5m till up to late 50s of the 20th century, increased many folds in some glaciers in the Central and the Eastern Himalayas during the decade of mid seventies to late eighties, touching a value of as high 25m-30m as in the case of the Gangotri glacier. The retreat, with the advent of the decade of the nineties, began to slow down and in some cases like the Siachen glacier, Machoi glacier, Darung Drung glacier, Gangotri glacier, Satopanth-Bhagirath Kharak glaciers and the Zemu glacier, it has practically come down to stand still during the period 2007-09. It may be noted here that some of the glaciers in the Kumaon Himalayas like the Pindari glacier have been exhibiting a high annual retreat of the order of 8m-10m since the first recording was made in 1906.”
The above study also states: “Data that has been generated from the glacier studies, in the Himalayas, over the last 100 years or so, indicates that the glaciers, in the Himalayas, have been, by and large, shrinking and retreating continuously, barring a flip here and there, but the rate of retreat cannot be considered as alarming/abnormal, especially in the last decade or so.”
The following figure shows a composite image showing retreat of the Gangotri Glacier terminus in the Garhwal Himalaya since 1780 [http://nsidc.org/glims/glaciermelt/index.html]
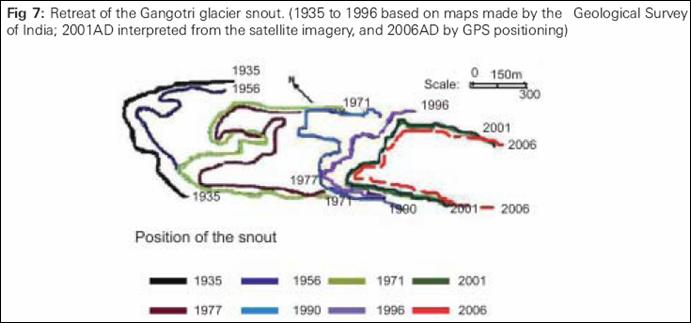
The following figure (from [http://www.mtnforum.org/rs/ol/browse.cfm?tp=vd&docid=5408]) shows the Gangotri Glacier snout recession updated to 2006. The rate of recession has declined since the 1970s.
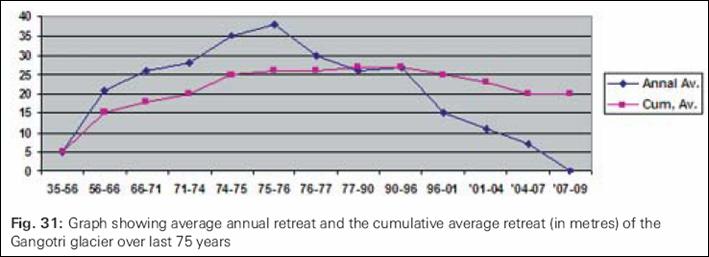
The following figure (from [http://www.mtnforum.org/rs/ol/browse.cfm?tp=vd&docid=5408]) shows the annual average retreat of the Gangotri Glacier over the last 75 years. The peak rate of retreat was in the 1970s. Since then the rate of retreat has declined. This is exactly the opposite of what the scare-mongers tell us.
The Times of India reported the following (Mar 2008): “Contrary to what prophets of doom contend, that Gangotri will disappear in the next 30 to 40 years, some of India’s leading scientists believe there's no immediate or even medium-term threat to the glacier that feeds one of India's greatest rivers, Ganga. Gangotri's drawdown - 20 metres per annum in the '70s - is now mere six metres a year. Bhagirath Khadak in the Himalayas was retreating at 12 m annually but last year it didn't recede at all. Machoi in Jammu & Kashmir has showed no change since 1957. Same is true of Siachen and Kagriz in Ladakh, according to the Geological Survey of India. Even if Gangotri retreats at 20 m per annum, it will last for 1,500 years, according to V K Raina, chairman, Monitoring Committee on Himalayan Glaciology. "The discharge in Ganga had increased in 2001 when there was heavy snowfall. Raina, also a former deputy director general of GSI, said doomsayers have based their claims of a much shorter life of Gangotri on the basis of reduction in discharge of water from the glacier into the Ganga. But, he said, the glacier contributes only 25% to river discharge - the remaining 75% depends on snowfall and rainwater. This year, too, the snowfall's been heavy, hence the discharge will increase," he said. Not only the rate of retreat of Gangotri has decreased, in Leh, 123 years of temperature data shows a cooling of .04 degree per decade." [http://timesofindia.indiatimes.com/No_threat_to_Gangotri/articleshow/2892632.cms]
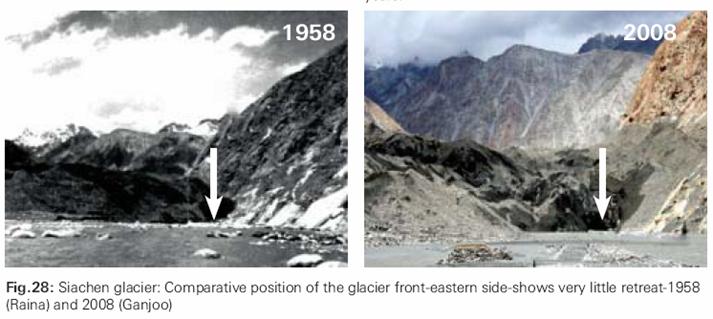
Evidence from the Siachen Glacier in the Himalayas indicates substantial decadal variation rather than a constant retreat due to global warming [http://www.ias.ac.in/currsci/aug102009/309.pdf]. The following figure shows the Siachen glacier (from [http://www.mtnforum.org/rs/ol/browse.cfm?tp=vd&docid=5408]): “Siachen glacier, the second largest glacier known outside the polar and sub- Polar Regions, is a valley glacier, about 74km long, situated within the coordinate 350 12’ & 350 41’ N: 770 11’ & 760 47’ E, Survey of India, Sheet No. 52E. Snout of this glacier has been under observation, off and on, since 1848 and has not shown any abnormal retreat in the last fifty years that would justify the sensational forecast made that this glacier is going to finish in next 50 years.”
The Kangriz glacier has not retreated at all in almost 100 years, as shown in the following figure. [http://moef.nic.in/downloads/public-information/MoEF%20Discussion%20Paper%20_him.pdf]
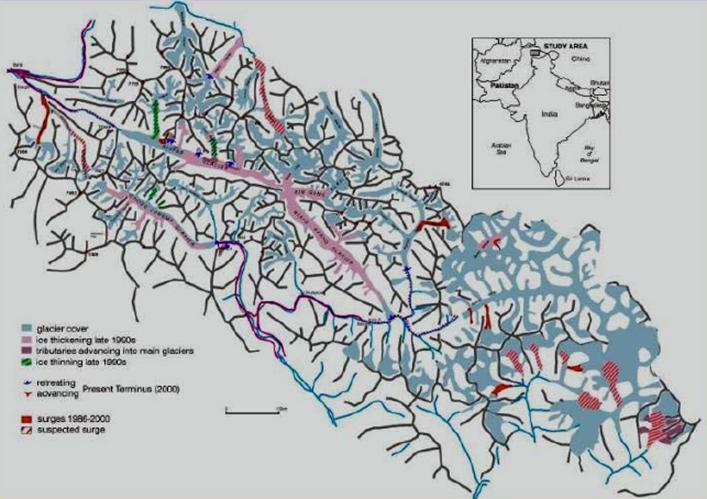
The glaciers of the Karakoram area of the Himalayas have mainly been advancing in recent decades. “The Karakoram, lying immediately north of the western part of the greater Himalaya, is the highest of the southwest central Asian mountain systems. It has the largest concentration of glaciers on mainland Asia and outside high latitudes, with 8 glaciers over 50 km in length and more than 20 over 30 km. The perennial snow and ice cover, exceeding 16,000 km2, comprises a huge fresh water store in a generally arid, drought-prone region. Glacial meltwaters make a major contribution to the flow of the Indus and Yarkand Rivers and to the livelihood of some 130 million people.” [http://www.agu.org/eos_elec/97106e.html]
The following figure shows the glaciers of the Karakorum. The report states: “Most reports have mistakenly suggested that these glaciers are ‘disappearing’. Unlike the rest of the Himalaya … there has been no massive or even net reduction in the ice cover in the last three decades … more than 35 glaciers advancing, mid-glacier thickening in a dozen others” [http://www.wilsoncenter.org/events/docs/Hewitt_presentation.pdf].
The author of the above referenced report on Karakorum glaciers (Kenneth Hewitt – Cold Regions Research Centre, Wilfred Laurier University) suggests of the following: “Misleading assessments? (to date, no evidence to support these assertions)”:
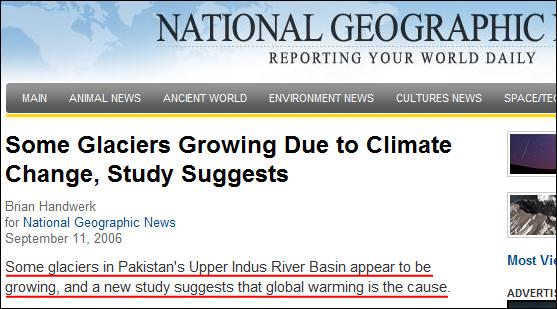
And of course, global warming causes glaciers to grow as well as recede: “the region's [Western Himalaya, Karakoram, and Hindu Kush mountain ranges] winter snowfall, which feeds the glaciers, has been increasing. And average summer temperatures, which melt snow and glaciers, have been dropping. The combination of reduced summer melt and more winter snowfall could account for glacial growth, according to work to be published by Archer and colleagues in an upcoming issue of the American Meteorological Society's Journal of Climate.” [http://news.nationalgeographic.com/news/2006/09/060911-growing-glaciers.html]
A University of California – Irvine study shows that northern India groundwater reduction is due to overconsumption. “NASA hydrologists have found that groundwater beneath northern India has been receding by as much as 1 foot per year over the past decade - and they believe human consumption is almost entirely to blame. More than 109 cubic kilometers (26 cubic miles) of groundwater disappeared from the region's aquifers between 2002 and 2008 - double the capacity of India's largest surface-water reservoir, the Upper Wainganga, and triple that of Lake Mead, the largest manmade reservoir in the U.S. People are pumping northern India's underground water, mostly to irrigate cropland, faster than natural processes can replenish it.” [http://www.uci.edu/features/feature_indiagroundwater_090812.php]
|
|
|
|
Other Asia (i.e. other than Himalayas)
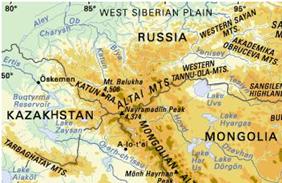
Altai Mountains
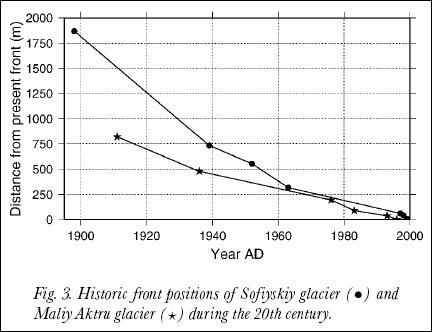
Archaeology Magazine produced a scaremongering story (Andrew Curry: “Climate Change: Sites in Peril”, Archaeology, March/April 2009 – see: http://www.appinsys.com/GlobalWarming/ArchaeologyMag.htm) The article states: “The glaciers that covered the slopes of the Altai are receding and even disappearing.” This is similar to glaciers throughout most of the world – they have been receding since the Little Ice Age in the 1700s. The following figure shows the recession of the two largest glaciers in the Altai [http://homepages.vub.ac.be/~fpattyn/papers/Pattyn2003_Ann37.pdf]. They have been disappearing since before recording of their position began in the late 1800s – early 1900s. For the largest glacier, the rate of recession has actually slowed down.
A lack of long-term instrumental data in the area makes it difficult to determine whether recent warming is cyclical or on a longer-term trend. A 2007 study (Andreev, Pierau, Kalugin, Daryin, Smolyaninova and Diekman, “Environmental changes in the northern Altai during the last millennium documented in Lake Teletskoye pollen record”, Quaternary Research Vol 67, 2007 [http://www.sciencedirect.com/science?_ob=ArticleURL&_udi=B6WPN-4MR1K7G-1&_user=10&_rdoc=1&_fmt=&_orig=search&_sort=d&view=c&_acct=C000050221&_version=1&_urlVersion=0 &_userid=10&md5=784b6911da31fdcc8dd14ffe3a3fd40a] states “A high-resolution pollen record from Lake Teletskoye documents the climate-related vegetation history of the northern Altai Mountain region during the last millennium. … between ca. AD 1050 and 1100. The climate was similar to modern. In the beginning of the 12th century, [evidence] point to colder and more arid climate conditions than before … Around AD 1200, regional climate became warmer and more humid than present … Climatic conditions were rather stable until ca. AD 1410. … slightly drier climate conditions between AD 1410 and 1560. …further deterioration of climate conditions between AD 1560 and 1810, consistent with the Little Ice Age. After AD 1850 the vegetation gradually approached the modern one, in conjunction with ongoing climate warming.”
So, from 1200 – 1400 the Altai was “warmer and more humid than present” and the current warming period has been occurring since the early 1800s, since the Little Ice Age.
|
|
|
|
The Jakobshavn Glacier has been retreating since observations began being recorded in the 1800s. The following figure shows the retreat of the glacier since before 1850. [http://www.ametsoc.org/atmospolicy/documents/Thompson%20Senate307.pdf]
|
|
|
|
A study of ice cores from glaciers in South America (Thompson L.G., Mosely-Thompson E., Dansgaard, W., and Grootes, P.M., “The Little Ice Age As Recorded in the Stratigraphy of the Tropical Quelccaya Ice Cap”, Science 1986) states: “Ice cores from the tropical Quelccaya Ice Cap suggest that the Little Ice Age occurred in South America between 1490 and 1880 with onset and termination within a few decades.” The following figure shows the Quelccaya glacier net mass accumulation (An) over the last 400 years. [http://www.pnas.org/content/103/28/10536.full.pdf+html]
|
|
|
|
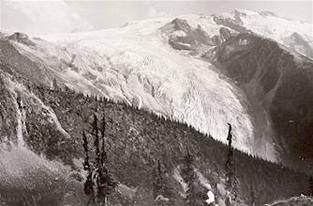
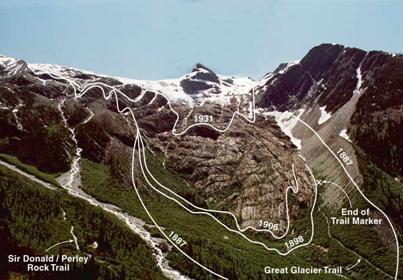
Long term data is the key to understanding climate change. “On her second visit to Glacier National Park in 1894, Mary Vaux was aghast at how the Illecillewaet Glacier had retreated since her previous visit seven years earlier. The lowest edge of the Great Glacier, as it was also known then, was clearly withdrawing upslope. We now know that most of the world’s glaciers were in retreat then, as they are now.” [http://www.cmiae.org/Resources/glaciers-lichens.php] The following figures show that “Illecillewaet Glacier in British Columbia's Glacier National Park (Canada) has retreated 2000 m since first photographed in 1887”
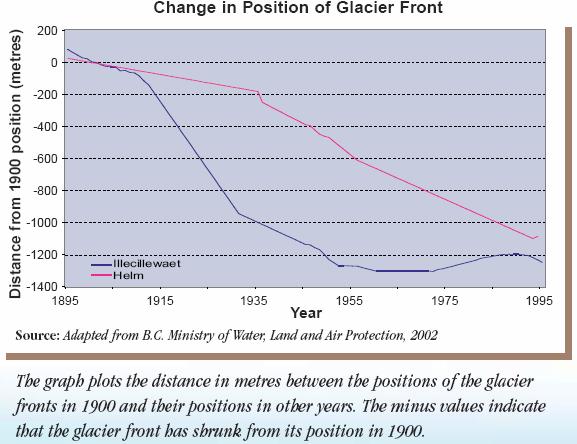
The following figure compares the different rates of retreat of two glaciers in British Columbia, including the above Illecillewaet glacier. “both glaciers shrank by more than a kilometre between 1895 and 1995, although they have done so at different rates. The Helm Glacier has shrunk fairly steadily, but the Illecillewaet Glacier has changed more erratically, shrinking rapidly in the early part of the last century but then advancing in the 1970s and 1980s before staring to shrink again.” [http://www.ccme.ca/assets/pdf/cc_ind_nature_glaciers_e.pdf]
|
|
|