Global Warming Science - www.appinsys.com/GlobalWarming
Colorado River, USA
[last update: 2010/02/24]
|
Alarm! Alarm! Lake Powell is Drying Up Due to Global Warming!
[http://www.csmonitor.com/USA/2008/0213/p25s05-usgn.html]
“Lake Mead and Lake Powell, which supply water and power to millions in the American Southwest, stand a 50 percent chance of running dry by 2021 … Dr. Barnett published additional work in the journal Science attributing 60 percent of the reduction in snowpack, rising temperatures, and reduced river flows over the past 50 years to global warming.”
The Colorado River fills Lake Powell on the Utah/Arizona border and Lake Mead on the Arizona/Nevada border.
|
|
Colorado River Flow
The following figure shows the Colorado River flow for the past 100 years [http://pubs.usgs.gov/fs/2004/3062/]. There has been continuous decline of the flow since the 1920s – obviously not a result of anthropogenic global warming (which officially started in the 1970s).
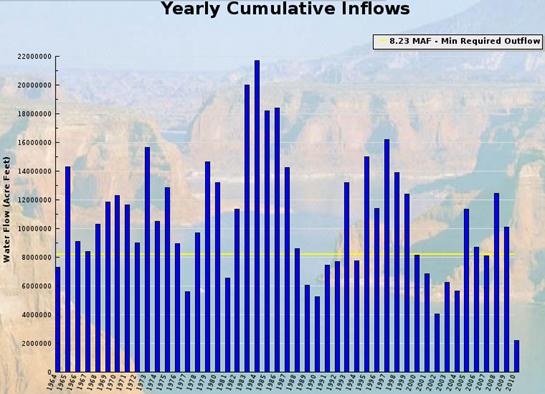
The following figure shows the yearly flow into Lake Powell since the Glen Canyon Dam was built in 1964 (as of Feb 2010) [http://graphs.water-data.com/lakepowell/index.php]
Combining the above two graphs gives the following updated graph:
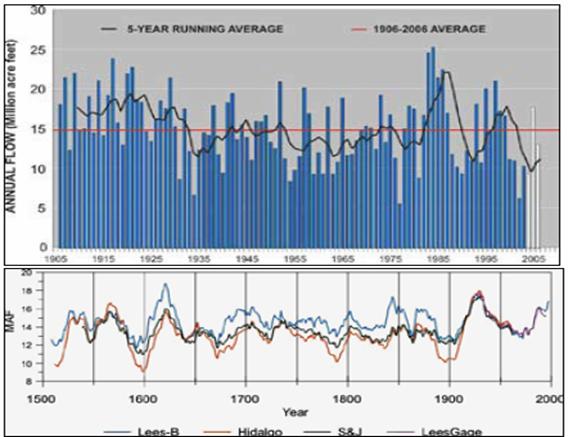
The following figures show Colorado River flow for 1905 – 2005 (top) and 1500 – 2000 (bottom) at Lees Ferry. [http://dels.nas.edu/dels/rpt_briefs/colorado_river_management_final.pdf] Putting the 20th century data in long term perspective shows that the river has gone through similar cycles in the past.
“Multi-century, tree-ring based reconstructions of Colorado River flow indicate that extended drought episodes are a recurrent and integral feature of the basin’s climate. Moreover, the range of natural variability present in the streamflow reconstructions reveals greater hydrologic variability than that reflected in the gaged record, particularly with regard to drought. These reconstructions, along with temperature trends and projections for the region, suggest that future droughts will recur and that they may exceed the severity of droughts of historical experience, such as the drought of the late 1990s and early 2000s.” [http://wwa.colorado.edu/treeflow/lees/final.html]
The Western Water Assessment states: “Does the now 100-year-long natural flow record capture the full range of natural variability of Colorado River streamflow? This seems unlikely” [http://wwa.colorado.edu/treeflow/lees/gage.html]
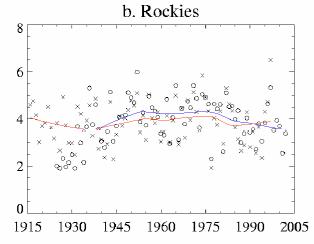
Most of the Colorado River inflow comes from the Rocky Mountains. The following figure shows the regional average April 1 snow water equivalent (SWE) for the Rockies. It is clear that the annual variation greatly exceeds any trend. [http://www.cses.washington.edu/db/pdf/moteetalvarandtrends436.pdf]
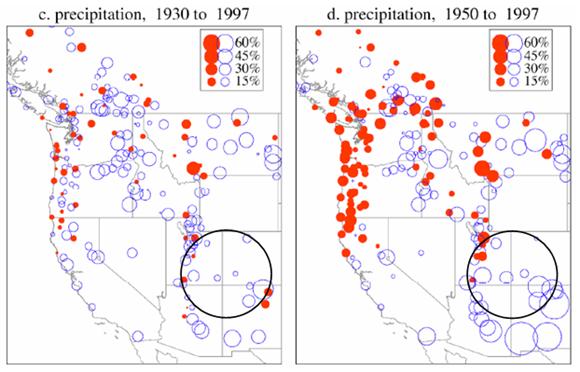
The following figures show the linear trend in precipitation for the western US (red circles are declining trends, blue circles are increasing trends). [http://www.cses.washington.edu/db/pdf/moteetalvarandtrends436.pdf] The approximate area feeding the Colorado River upstream from Lake Powell is indicated by the black circle. There has been no significant decline in precipitation in this area.
The above figures illustrate a common problem in climate statistics – the selection of a starting point can provide a different story.
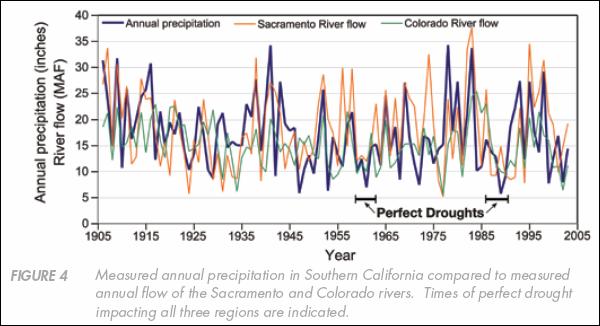
The following figure compares Colorado and Sacramento river flow with precipitation and shows periods of drought. [http://wwa.colorado.edu/colorado_river/docs/Colorado_River_Basin_Climate.pdf]
The above cited study states: “However, our instrumental records of precipitation and river flow extend back in time only 100 years or so. This time span is insufficient to capture the full range of natural variability in the climate of California and the west.”
|
|
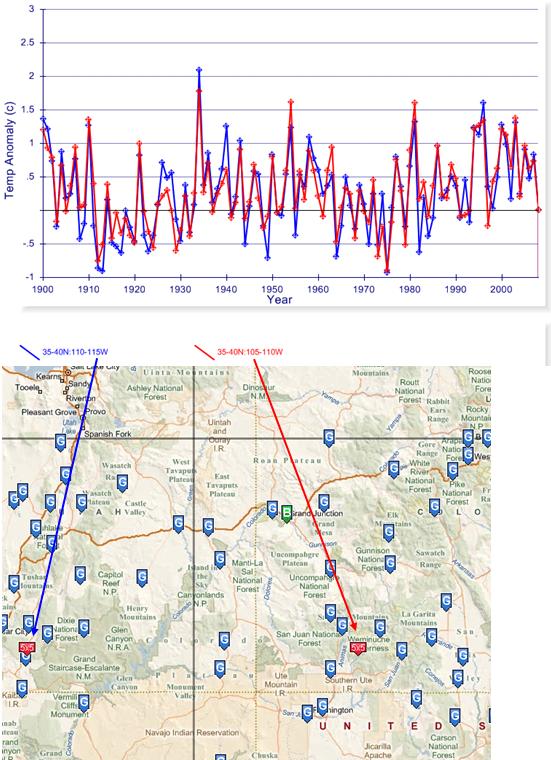
Colorado River Basin Temperatures
The following figure shows annual average temperature anomailes for the two 5x5 degree grids covering most of the Colorado River Basin upstream from Lake Powell for 1900 to 2008. (Data from the Climatic Research Unit – CRUTEM3 database, plotted at http://www.appinsys.com/GlobalWarming/climate.aspx) There has been no significant long term warming in the area.
|
|
See: http://www.appinsys.com/GlobalWarming/GW_4CE_Precipitation.htm for more info on precipitation
See: http://www.appinsys.com/GlobalWarming/RS_Colorado.htm for more details on Colorado climate
|
|
|