Global Warming Science - www.appinsys.com/GlobalWarming
US Had “Hottest” Year in 2012, Globally: Not So
[last update: 2013/01/12]
|
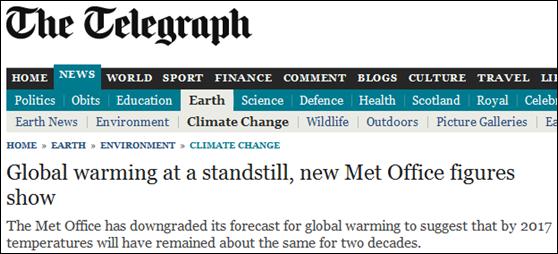
Jan 8, 2013: 2012 hottest year on record in contiguous U.S., NOAA says
From the above link: “Temperatures in the contiguous United States last year were the hottest in more than a century of record-keeping, shattering the mark set in 1998 by a wide margin, the federal government announced Tuesday. … Tuesday’s report did not address global temperatures. Still, the NOAA analysis has triggered an intense debate over whether global temperatures will reach dangerous levels by the century’s end.”
|
|
US 2012 – “shattering the mark set in 1998 by a wide margin”
A 1989 New York Times article: [http://www.nytimes.com/1989/02/04/us/global-warmth-in-88-is-found-to-set-a-record.html] “Last week, scientists from the United States Commerce Department's National Oceanic and Atmospheric Administration said that a study of temperature readings for the contiguous 48 states over the last century showed there had been no significant change in average temperature over that period. Dr. Jones said in a telephone interview today that his own results for the 48 states agreed with those findings. But he said there was no inconsistency between the apparent stable trend in the United States and the rise in global temperature because the 48 states cover a very small fraction of the earth's surface and there are bound to be regional variations in climate.”
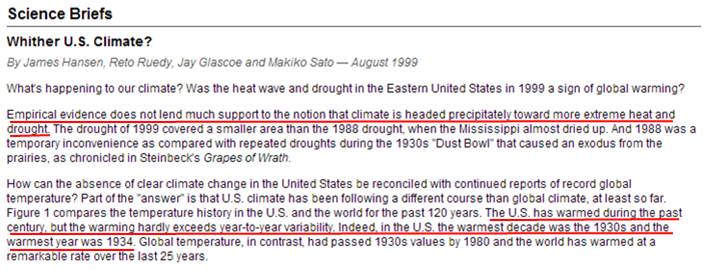
A 1999 NASA report:
[http://www.giss.nasa.gov/research/briefs/hansen_07/]
The same 1999 NASA report also states: “in the U.S. there has been little temperature change in the past 50 years, the time of rapidly increasing greenhouse gases — in fact, there was a slight cooling throughout much of the country ”
So how did this non-warming in the US by 1999 become such a heat wave by 2012 ? The U.S. temperatures are based on an ever-increasing adjustment of historical data to produce warming, and the major change to the adjustment methods was made in 2000.
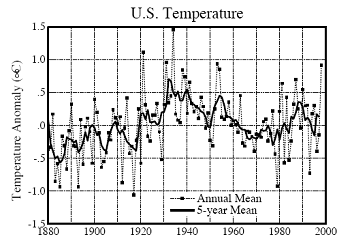
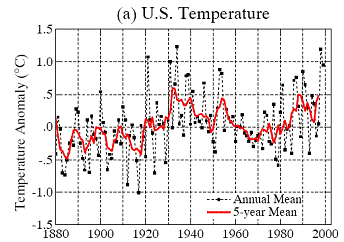
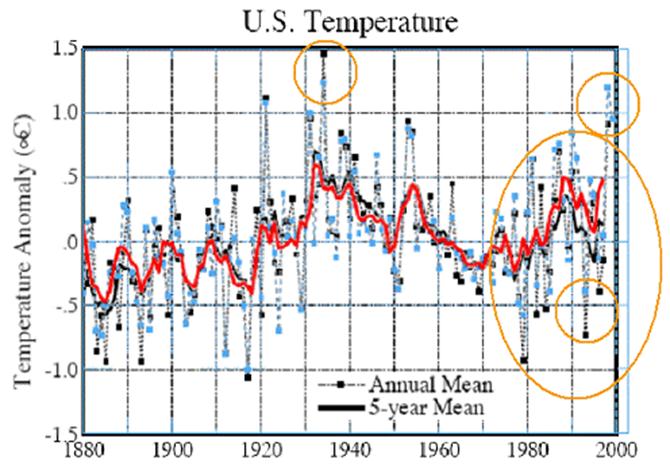
The following graphs show the historical US data from the GISS database as published in 1999 and 2001. Left graph – produced in 1999 (Hansen et al 1999 [http://pubs.giss.nasa.gov/docs/1999/1999_Hansen_etal.pdf]) Right graph – produced in 2000 (Hansen et al 2001 [http://pubs.giss.nasa.gov/docs/2001/2001_Hansen_etal.pdf]). They are from the same raw data – the only difference is that the adjustment method was changed by NASA in 2000.
U.S. Temperature Changes Due to Change in Adjustment Methods (Left: 1999, Right 2001)
The following figure compares the above two graphs, showing how an increase in temperature trend was achieved simply by changing the method of adjusting the data. Some of the major changes are highlighted in this figure: temperatures were reduced in the 1930s and increased in the 1980s and 1990s. Formerly 1934 was the warmest year and then – presto – suddenly 1998 is the warmest year.
(For more about temperature trends in the US see: http://www.appinsys.com/GlobalWarming/US_NoWarming.htm)
(For more about the data adjustments see: http://www.appinsys.com/GlobalWarming/GW_Part2_GlobalTempMeasure.htm and: http://www.appinsys.com/GlobalWarming/Hansen_GlobalTemp.htm)
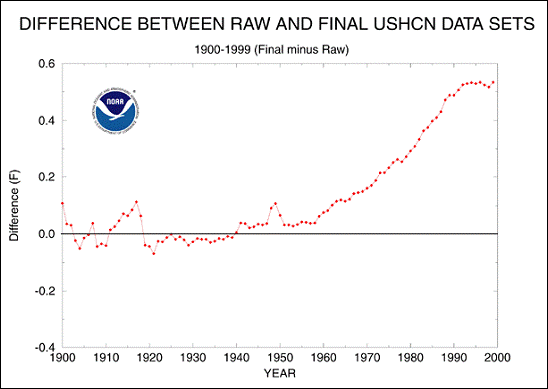
In 1999 NOAA provided a summary of the adjustments made to the US temperature data as shown in the following figure. [http://www.ncdc.noaa.gov/oa/climate/research/ushcn/ushcn.html] The report states: “The cumulative effect of all adjustments is approximately a one-half degree Fahrenheit warming in the annual time series over a 50-year period from the 1940's until the last decade of the century.” This is similar to the total amount of warming “observed” up to 2000.
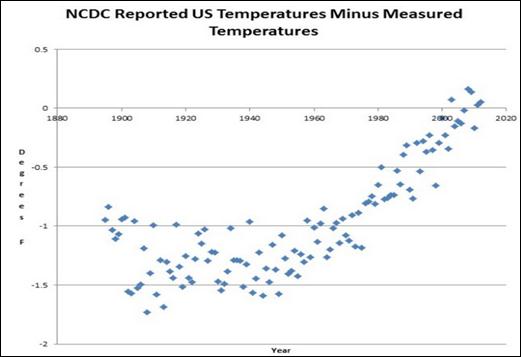
Steven Goddard provides an updated graph of the US temperature adjustments – the total adjustments are now more than 1 degree: [http://stevengoddard.wordpress.com/2013/01/09/the-noaa-fraud-hockey-stick/]
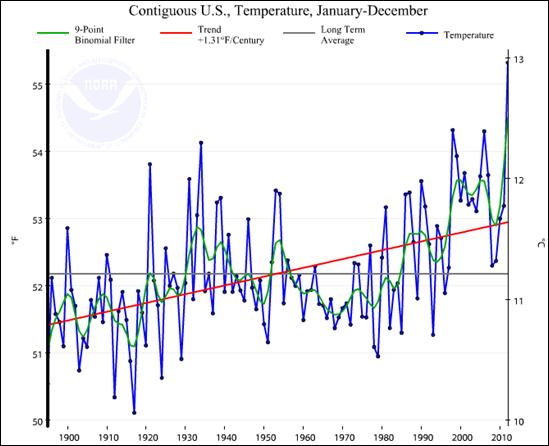
The following figure shows the current official contiguous US temperature series after all of the adjustments are applied. [http://www.ncdc.noaa.gov/temp-and-precip/time-series/index.php?parameter=tmp&month=12&year=2012&filter=12&state=110&div=0]
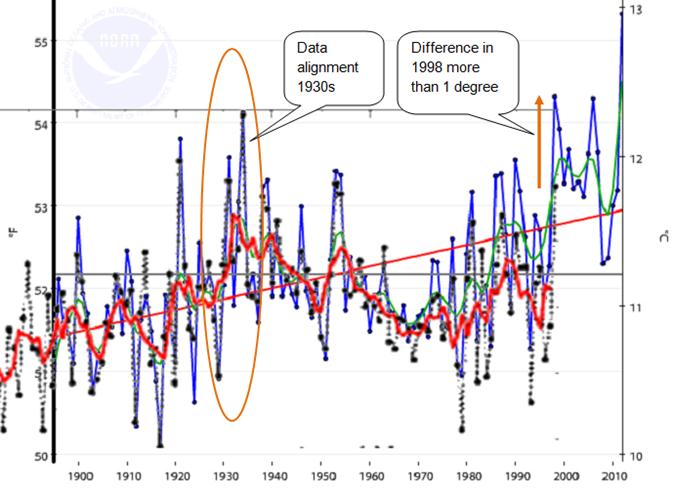
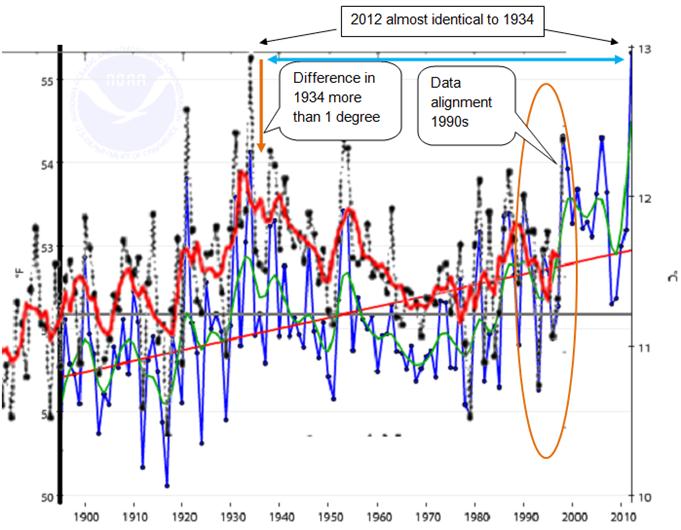
The following figures superimpose the official data as of 1999 onto the above plot through 2012. The top figure below has a 1930s alignment between the two data sets, while the bottom figure has a 1990s alignment.
The figure above shows that the significant change in data adjustments made to the historical data after 2000 resulted in an increased 1998 of more than 1 degree (F). The figure below shows that if the significant change in data adjustments hadn’t been made, the 2012 temperature would be virtually identical to 1934.
While the alarmists are exclaiming that the warmest ever, 2012 US temperature, is more than 1 degree warmer than 1998, the fact is that it’s only due to revised data adjustments that 1998 seems warmer than 1934, by increasing 1998 by more than 1 degree. Without those creative adjustments, there is really no difference between 1934 and 2012.
|
|
Global Non-Warming
While NOAA / NCDC / NASA are continuing to create increased apparent warming in the US through data adjustments, the global temperature has been essentially flat for 15 years. And the models use by the UK Met Office and Climatic Research Unit (CRU) – used by the IPCC, now say global warming is, well, not warming.
From the above article: “Labour MP Graham Stringer … said: “They failed completely with their models to predict the flattening out of global warming. I think that they are just trying to bury bad news that their predictions in the medium and long-term have been pretty poor.””
According to NOAA 2008 State of the Climate report, regarding climate models (which are based on CO2 for driving the warming): “Near-zero and even negative trends are common for intervals of a decade or less in the simulations, due to the model’s internal climate variability. The simulations rule out (at the 95% level) zero trends for intervals of 15 yr or more, suggesting that an observed absence of warming of this duration is needed to create a discrepancy with the expected present-day warming rate.” [http://www1.ncdc.noaa.gov/pub/data/cmb/bams-sotc/climate-assessment-2008-lo-rez.pdf]
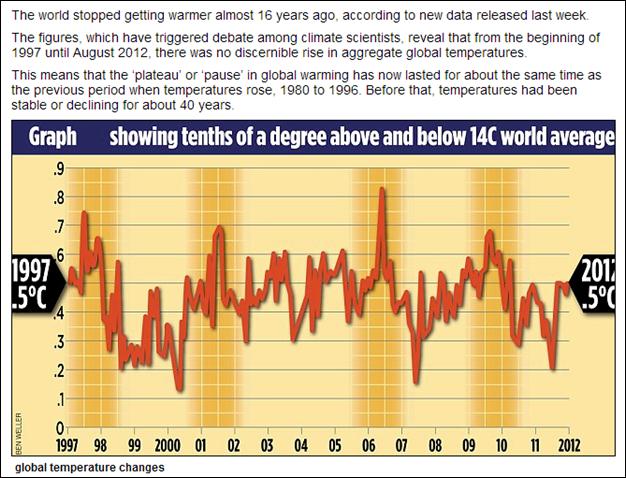
The following figure shows the global temperature anomaly for the past 16 years. [http://www.dailymail.co.uk/sciencetech/article-2217286/Global-warming-stopped-16-years-ago-reveals-Met-Office-report-quietly-released--chart-prove-it.html#ixzz29E78OR9H]
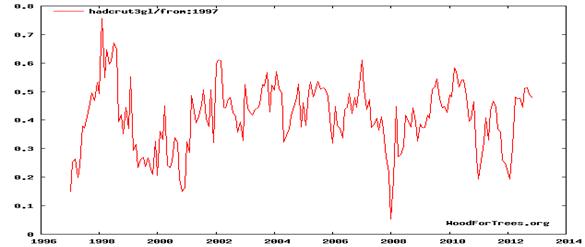
The above data can be plotted with interactive up-to-date data at: http://www.woodfortrees.org/plot/hadcrut3gl/from:1997:
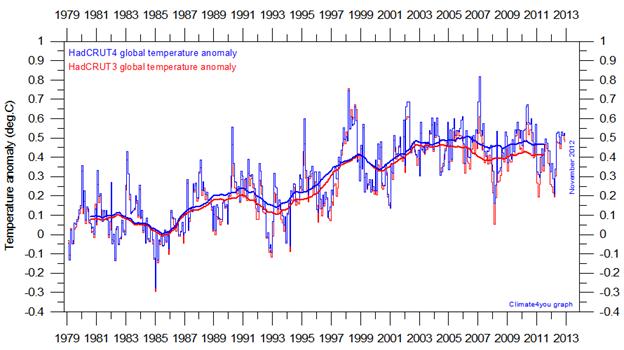
Even though global warming has ceased, the CRU keeps adjusting the global data to try to increase warming. The following figure compares the updated HadCRUT4 (blue) with the previous version of the same data (HadCRUT3 – red) – the only difference is the adjustments applied to the data. [http://climate4you.com/GlobalTemperatures.htm]
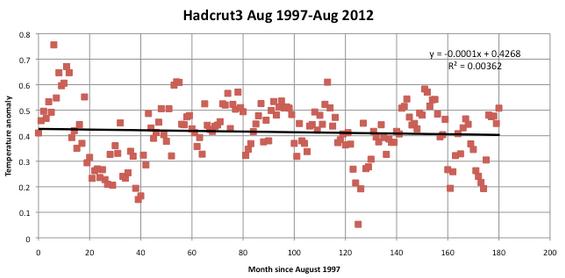
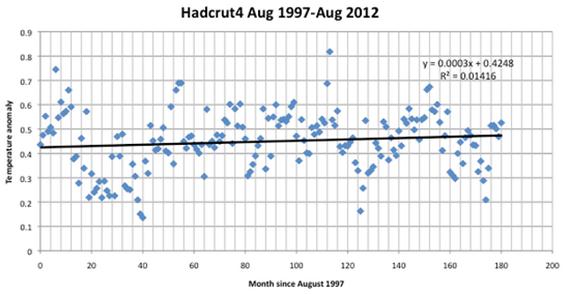
The above figure is from 1979 (the start of the satellite data period). The following figures show the HadCRUT data since 1997 – the year in which the global temperature stopped increasing. They turned a 15-year slight cooling trend into a slight warming trend (both still insignificant from zero as trends). [http://clivebest.com/blog/?p=4237]
So, no global warming for 15 years; no projected warming for the next 5 years – 20 years of no warming. While the warming period (1977 – 1997) was also only 20 years. Atmospheric CO2 continues to increase (and has not slowed), but global warming caused by this? – I don’t think so.
The official data adjustments continue to produce warming.
|
|
|