Global Warming Science - www.appinsys.com/GlobalWarming
South America
[last update: 2010/04/20]
|
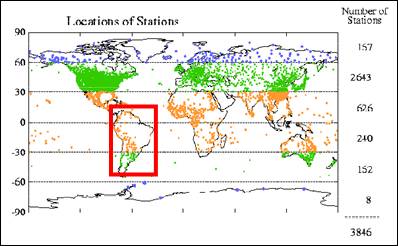
There are very few stations in South America with long-term data.
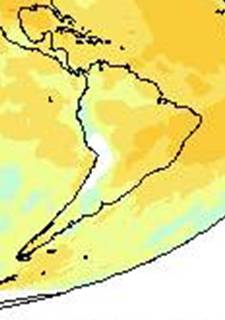
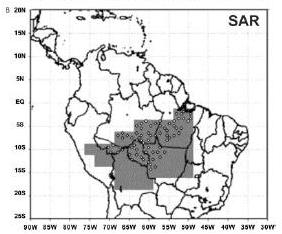
The following figure shows satellite temperature data trend from the RSS analysis 1979 - 2008 for South America [http://www.ssmi.com/msu/msu_data_description.html].
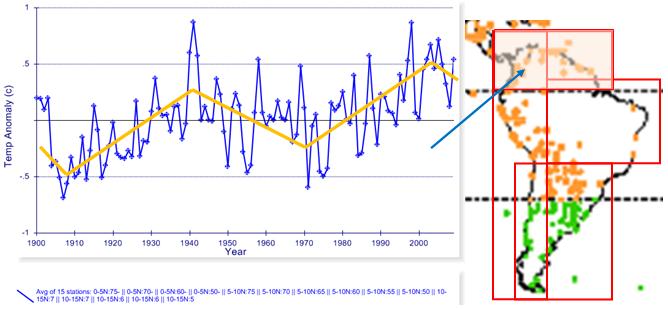
The following figures show average temperature anomalies for 1900 – 2006 (from the GHCN database) and then superimposed on the IPCC model plots (from AR4 Fig 9.12) for Amazon and Southern South America (pink= models with CO2, blue= models without CO2, black= observed). The third pair is similar but for all of South America (with IPCC plot from AR4 Fig SPM-4) .
|
|
HadCRU Gridded Data – CRUTEM3 Database
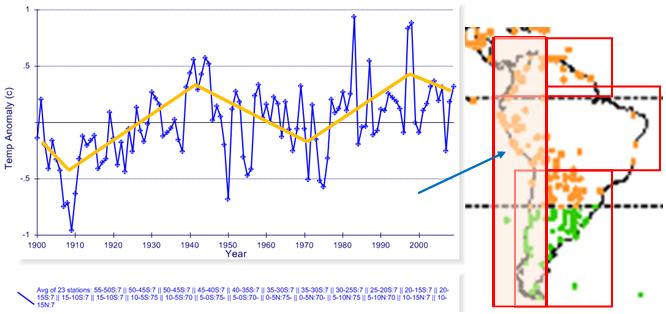
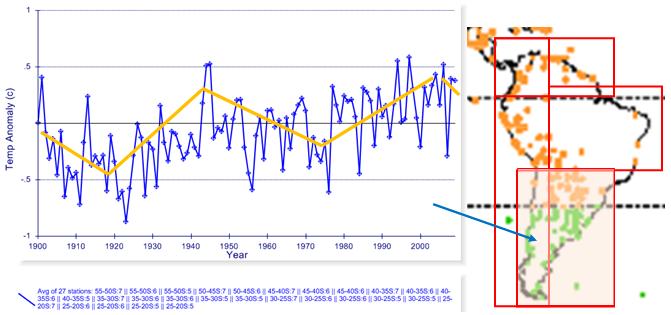
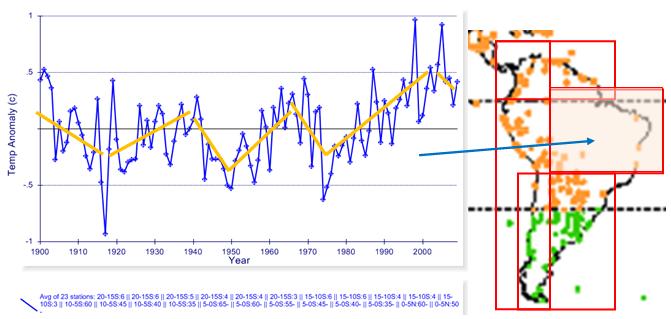
The following figures show average temperature anomalies for 1900 – 2009 (from the HadCRU CRUTEM3 database plotted at http://www.appinsys.com/GlobalWarming/climate.aspx) for four regions within South America.
0-15Nx50-80W
15N-55Sx70-80W
20-55Sx50-75W
5N-20Sx35-70W
|
|
NASA GISS Station Data – Urban and Rural Stations by Region
Northern South America:
Urban:
Rural: There are no long-term rural stations in northern South America.
Amazon:
Urban:
Rural: There are no long-term rural stations in the Amazon. There is only one long-term rural station near the Amazon (southeast of the mouth of the Amazon river):
Southern South America:
Urban:
Rural:
Western South America / Cordillera
Urban:
Rural:
For further examples of urban versus rural comparisons in South America see: http://www.metsul.com/secoes/visualiza.php?cod_subsecao=33&cod_texto=557 (in Portuguese).
|
|
Steve McIntyre of ClimateAudit.org plotted the monthly temperature data for a couple of stations in Bolivia. The NASA / GISS and NOAA / GHCN monthly data sets end in the 1980s for many stations, but the daily databases actually continue closer to the present. The following two figures show stations in Bolivia where the GHCN monthly data is no longer calculated after 1987. The black lines show monthly data from the NASA GISS data, the red lines show monthly data calculated from the daily data by Steve McIntyre, and the blue line shows the NASA GISS annual temperature data. In both cases the warming that started to appear in the 1980s disappeared in the more recent data.
|
|
Precipitation - Amazon
A 2008 study (Jose Marengo, “Long-term trends and cycles in the hydrometeorology of the Amazon basin since the late 1920s”, Hydrological Processes, 2009) states: “it is concluded that no systematic unidirectional long-term trends towards drier or wetter conditions have been identified since the 1920s. The rainfall and river series showing variability at inter-annual scales linked to El Niño Southern Oscillation was detected in rainfall in the northern Amazon. It has a low-frequency variability with a peak at - 30 years identified in both rainfall and river series in the Amazon. The presence of cycles rather than a trend is characteristic of rainfall in the Amazon” [http://www3.interscience.wiley.com/journal/122522640/abstract?CRETRY=1&SRETRY=0]
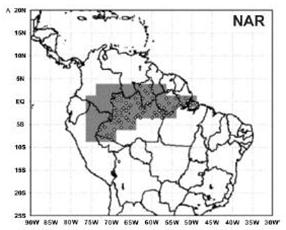
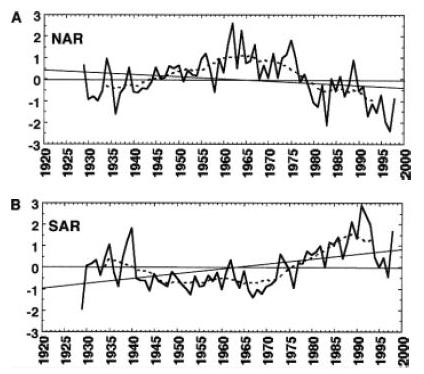
Patrick Michaels wrote a summary of the above study, which split the Amazon into north and south sectors for analysis. [http://www.worldclimatereport.com/index.php/2010/04/19/amazing-amazon-analysis/#more-422]
“The analysis of the annual rainfall time series in the Amazon represented by the NAR and SAR indices indicates slight negative trends for the northern Amazon and positive trends for the southern Amazon. However, they are weak and significant at 5% only in the southern Amazon”
“Since 1929, long-term tendencies and trends, some of them statistically significant, have been detected in a set of regional-average rainfall time series in the Amazon basin and supported by the analysis of some river streamflow time series. These long-term variations are more characteristic of decadal and multi-decadal modes, indicators of natural climate variability, rather than any unidirectional trend towards drier conditions (as one would expect, due to increased deforestation or to global warming).”
See also: http://www.appinsys.com/GlobalWarming/AmazonDrought.htm
|
|
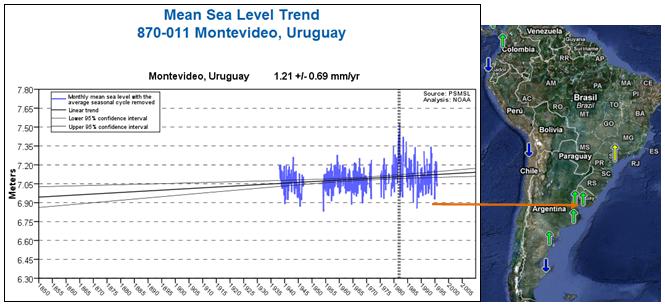
Sea Level
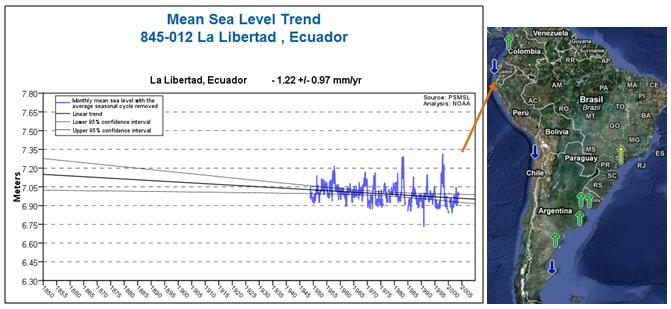
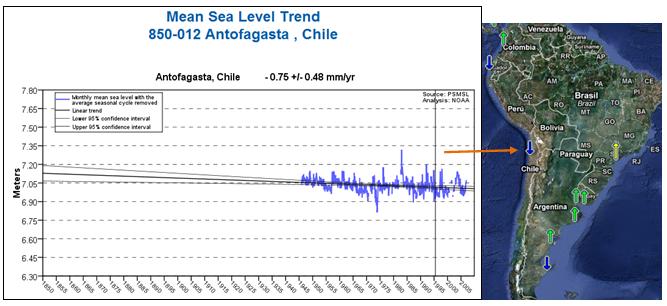
The following figures show sea level trends for three locations in South America (from the NOAA database [http://tidesandcurrents.noaa.gov/sltrends/index.shtml]) Sea level is decreasing on the west and south areas, and increasing on the east and north sides.
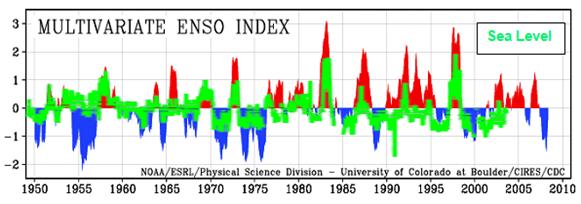
The sea level on the northwest side is influenced by the El Nino / Southern Oscillation. The following figure superimposes the sea level data for La Libertad, Ecuador from the top figure above (changed to green) on the multivariate ENSO Index. This shows a strong correlation between the ENSO and sea level variation. (See http://www.appinsys.com/GlobalWarming/ENSO.htm for more details on the ENSO index.)
|
|
|