Global Warming Science - www.appinsys.com/GlobalWarming
Montana (West), USA
[last update: 2010/04/12]
|
This document provides a regional study of the western part of Montana State, USA- the region including Glacier National Park.
Only temperature and precipitation stations that have data from prior to 1930 and after 1995 are included in this study, since climate studies are only valid by including long-term data.
|
|
12 April, 2010: Many news media have reported “2 More Glaciers Gone From Glacier National Park” (for example http://www.nytimes.com/aponline/2010/04/07/us/AP-US-Disappearing-Glaciers.html) and attribute it to global warming. The NYT article states “From the Himalayas to Alaska, glacier melting has accelerated in recent decades as global temperatures increased. … the rest of the glaciers may be gone by the end of the decade.”
Well, maybe not: “Based on the slow recession and equilibrium response of Blackfoot and Harrison Glacier to recent climate over the last 40 years these two glaciers are not going to disappear within the next 30 years. There are at least five glaciers in the park that have retreated slowly in the last 40 years and still have healthy accumulation zones, indicating they are not on the verge of disappearing.” [http://www.easternsnow.org/proceedings/2008/pelto.pdf]
|
|
Temperature
The following figure shows the temperature trends (average annual temperature) for long-term stations in western Montana from the NOAA GHCN database (plotted at: http://www.appinsys.com/GlobalWarming/climate.aspx). No long-term warming is observed.
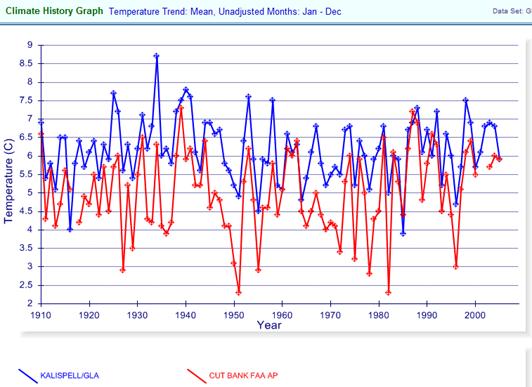
The following figure shows the average annual temperatures for the closest stations to Glacier National Park – Kalispell and Cut Bank – from the NOAA GHCN database No significant long-term warming trend is evident.
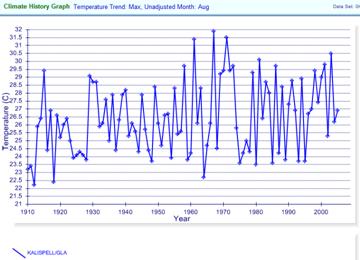
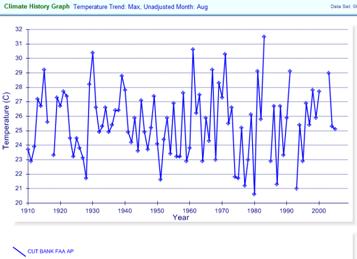
The following figures show the average August maximum temperatures for the same stations shown above (Kalispell and Cut Bank). No significant long-term warming trend is evident in the August maximum temperatures.
Average maximum August temperature:
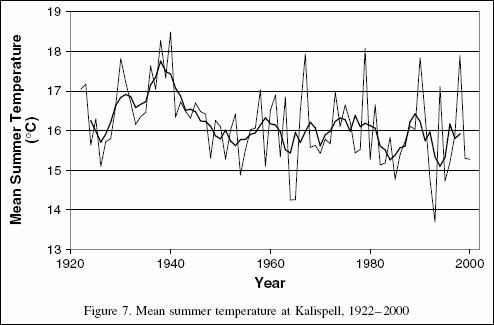
The following figure shows mean summer temperature at Kalispell – no warming trend [http://www.nrmsc.usgs.gov/files/norock/products/GCC/HydroProc_Selkowitz_02.pdf]
|
|
Precipitation / Drought
The following figure shows annual total precipitation data for three locations in western Montana. Although there has been recent drought in some areas (see Kalispell and Cut Bank below), the decadal trend does not have any correlation to CO2.
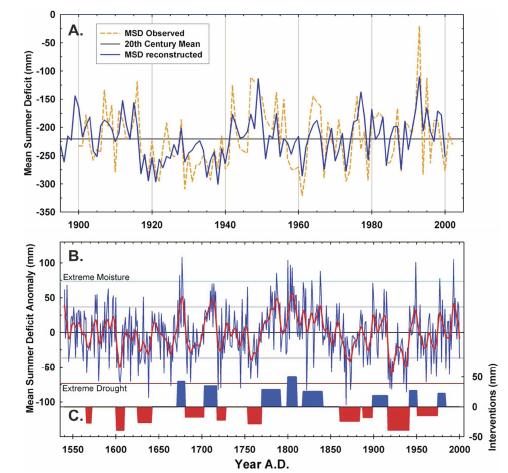
A 2006 paper by scientists at Montana State University and the U.S. Geological Survey (Pederson, G.T., S.T. Gray, D,B. Fagre, and L.J. Graumlich. 2006. “Long-Duration Drought Variability and Impacts on Ecosystem Services: A Case Study from Glacier National Park, Montana”. Earth Interactions, 10, Paper No. 4.) examined drought history for Glacier National Park and the surrounding area, using tree ring proxies. The following figure is from their paper. The top of the two plots shows the observed and reconstructed mean summer soil moisture deficit over the past century, while the lower plot shows us the reconstructed drought levels back to 1540. There is no correlation between drought and CO2.
Above: Glacier National Park Drought: (A) Comparison of the observed and reconstructed mean summer deficit records for the 1900–2000 calibration period. (B) Mean centered reconstructed mean summer deficit (blue line) and smoothed values (red line) spanning 1540–2000. (C) Decadal-scale drought regimes exhibiting the significant step changes in the mean.
|
|
Mountain Snowpack
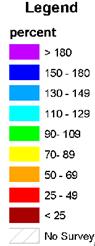
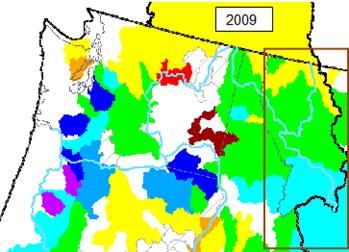
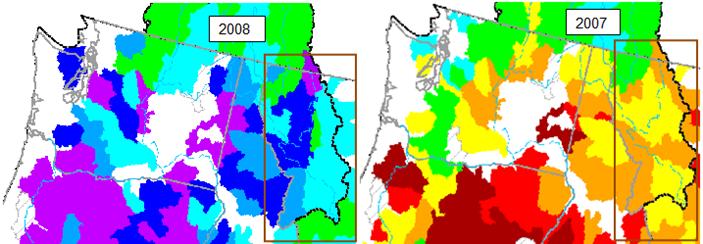
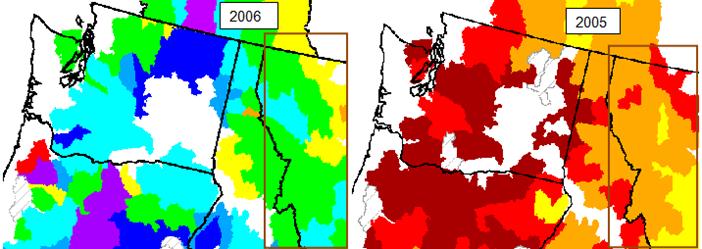
The following figures show mountain snowpack for the Pacific Northwest for May 1 for the last few years (from [http://www.wcc.nrcs.usda.gov/cgibin/westsnow.pl]) showing large annual variations. The western Montana / Glacier National Park area is highlighted by the brown rectangle.
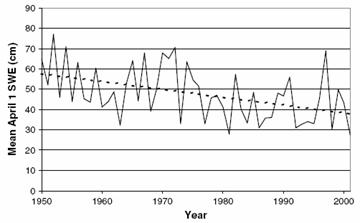
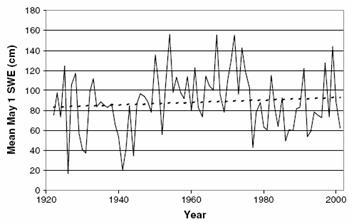
A 2002 study (Selkowitz et al, “Interannual variations in snowpack in the Crown of the Continent Ecosystem” [http://www.nrmsc.usgs.gov/files/norock/products/GCC/HydroProc_Selkowitz_02.pdf]) shows the following figures displaying (left) mean April 1 snow water equivalent (SWE) for the Crown of the Continent region since 1950 and (right) mean May 1 SWE for the Many Glacier drainage in Glacier National Park since 1922.
The effect of the starting point in affecting the linear trend is illustrated by combining the two graphs. The following figure superimposes the above left graph changed to red and shifted vertically. The two areas have very similar trends for the data since 1950. Including data from 1920 onwards gives a very different linear trend. This illustrates the problem of trying to evaluate climatic data when only a few decades of data are available – short-term data can be misleading.
|
|
Glaciers
The same Pederson et al study cited above provides the following figure showing the decreasing area of the Sperry Glacier over the available timeframe of observations (left). The graph (right) shows the glacier area versus year.
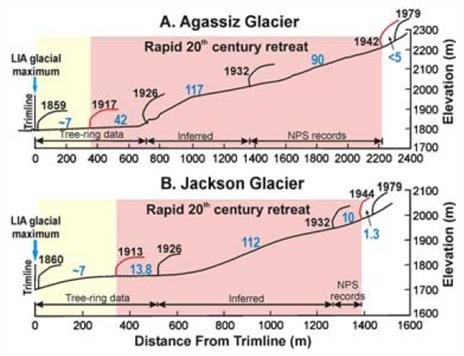
Another study “Decadal-scale Climate Drivers for Glacial Dynamics in Glacier National Park, Montana, USA” (Pederson, G. T., D. B. Fagre, S. T. Gray, and L. J. Graumlich (2004), Geophysics Research Letters) [http://www.agu.org/pubs/crossref/2004/2004GL019770.shtml] “the 1850's glacial maximum was likely produced by ∼70 yrs of cool/wet summers coupled with high snowpack. Post 1850, glacial retreat coincides with an extended period (>50 yr) of summer drought and low snowpack culminating in the exceptional events of 1917 to 1941 when retreat rates for some glaciers exceeded 100 m/yr. This research highlights potential local and ocean-based drivers of glacial dynamics, and difficulties in separating the effects of global climate change from regional expressions of decadal-scale climate variability.”
The above paper provides the following figure showing the retreat of the Agassiz and Jackson glaciers “Yellow shading indicates initiation of glacial recession in the late-19th and early-20th centuries. Red lines and red shading highlight changes in glacial margin position between the onset and termination of the severe 1917–1941 drought. Estimated net retreat rates (m/yr) are shown in blue.” [http://www.nrmsc.usgs.gov/files/norock/products/GCC/GeophysResLet_Pederson_04.pdf]
Similar to the Sperry glacier shown previously, the rapid retreat of Agassiz and Jackson glaciers occurred in the “severe 1917–1941 drought” – i.e. not the era blamed on anthropogenic CO2.
The Selkowitz et al study cited previously states: “Despite relatively stable snowpacks and summer temperatures since 1922, the glaciers in Glacier National Park have receded steadily during this period, implying a significant climatic shift between their Little Ice Age glacial maxima (ca 1860) and 1922.”
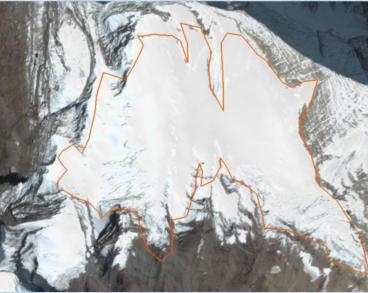
Not all of Glacier National Park’s glaciers are retreating. The following figure shows the largest glacier in the park – Harrison Glacier [http://www.nichols.edu/DEPARTMENTS/Glacier/glacier_retreat.htm] showing “the glacier margin in 2005 and orange line showing the 1966 margin map overlay on this SPOT satellite image. No evident change in the accumulation zone indicates an equilibrium response.”
|
|
Pacific Decadal Oscillation
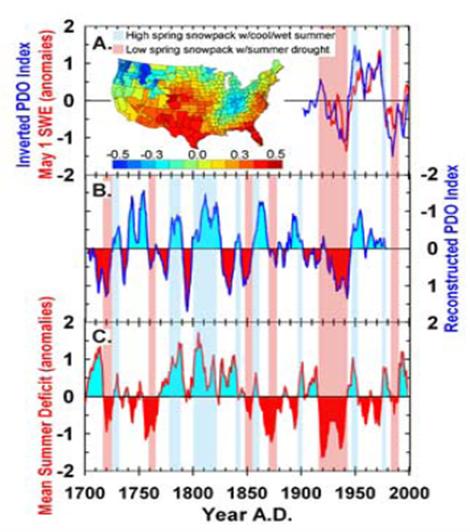
The same Pederson et al study quoted above compared the glacial mass balance with the Pacific Decadal Oscillation (PDO). The following figure is from the study, showing the following: Top: inverted PDO index compared with May 1 snow-water equivalent glacier mass balance, Middle: reconstructed PDO index (inverted), Bottom: mean summer deficit anomalies. The inset map shows the correlation between the PDO index and the winter precipitation. The study states: “negative values of the reconstructed PDO correspond with high winter snowpack as indicated by the strong relationship with instrumental May 1 SWE anomalies”.
The Selkowitz et al study cited previously states: “Snow course data indicate that variations in both 1 April and 1 May mean SWE are closely tied to the Pacific decadal oscillation”.
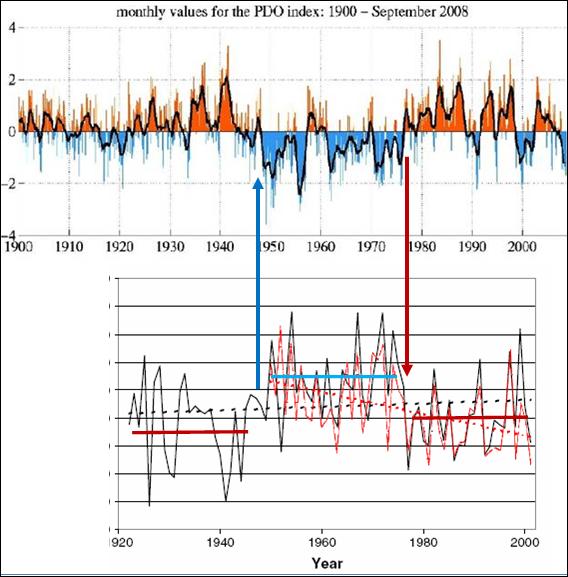
The PDO goes through warm and cool phases of the cycle with phases typically lasting about 30 years. The following figure shows the monthly PDO index from 1900 to September 2008 (from [http://jisao.washington.edu/pdo/]) combined with the mountain snowpack data (from Selkowitz et al shown previously). The recent phases of the PDO can be seen in the figure, with a cool phase starting around 1947 and switching to a warm phase in 1977. This clearly shows the influence on the PDO as well as the misleading use of linear trends on short-term data. The snowpack trend since 1977 (the CO2 affected era) has actually been increasing on average.
See http://www.appinsys.com/GlobalWarming/PDO.htm for more information on the PDO.
|
|
Conclusion
Glaciers in Glacier National Park have been retreating since the mid-1800s after the Little Ice Age ended – well before the CO2 era. Once again the AGW alarmists “confuse” the effects of the Pacific Decadal Oscillation with anthropogenic global warming and ignore the fact that glaciers have been receding for 150 years – well before the CO2 affected era.
|
|
|