Global Warming Science - www.appinsys.com/GlobalWarming
India
[last update: 2009/11/11]
|
India is important to the global warming debate – it has one of the largest and fastest modernizing populations on the planet and thus one of the highest CO2 emissions growth (although it is currently far behind China as being the largest CO2 emitter).
This document has sections on:
In July 2008, the Government of India published a National Action Plan on Climate Change, which states: "No firm link between the documented [climate] changes described below and warming due to anthropogenic climate change has yet been established." The report Overview states: "India is determined that its per capita greenhouse gas emissions will at no point exceed that of developed countries even as we pursue our development objectives." [pmindia.nic.in/Pg01-52.pdf]
In October 2009: “India signed an agreement with China, the world’s biggest polluter, to increase cooperation on tackling climate change after the countries rejected calls from rich nations to set binding caps on carbon emissions. … The world’s fastest-growing major economies called on rich nations to slash carbon dioxide output while refusing to accept binding reduction targets that they say will hurt development. … “There’s no way developing countries will accept caps.” [http://www.bloomberg.com/apps/news?pid=20601072&sid=aFyFHkF6C3Fs]
In November 2009: “the Indian government has challenged western research that says global warming has hastened the melting of Himalayan glaciers. … environment and forests minister Jairam Ramesh released a paper saying there was no evidence of such a link. … the doomsday prediction of the Intergovernmental Panel on Climate Change (IPCC) and Al Gore is also not correct.” [http://www.hindustantimes.com/Govt-quells-panic-over-Himalayan-glacial-melt/H1-Article3-474713.aspx]
Of course the IPCC had to accuse India of arrogance to deny global warming - Pachauri, the chairman of the IPCC, told the Guardian: "It is an extremely arrogant statement." See: [http://www.guardian.co.uk/environment/2009/nov/09/india-pachauri-climate-glaciers] Also see the actual glacier data later in this document which supports the Indian government’s position, not the IPCC.
Since India is not a UN Annex I country it will not be forced to pay or reduce emissions under the UN FCCC proposed Copenhagen plan (see: http://www.appinsys.com/GlobalWarming/UNCopenhagenPrep.htm)
|
|
|
|
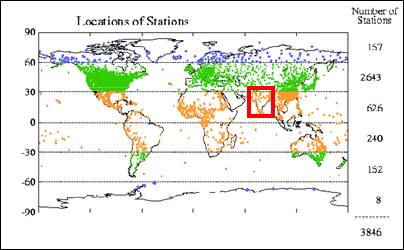
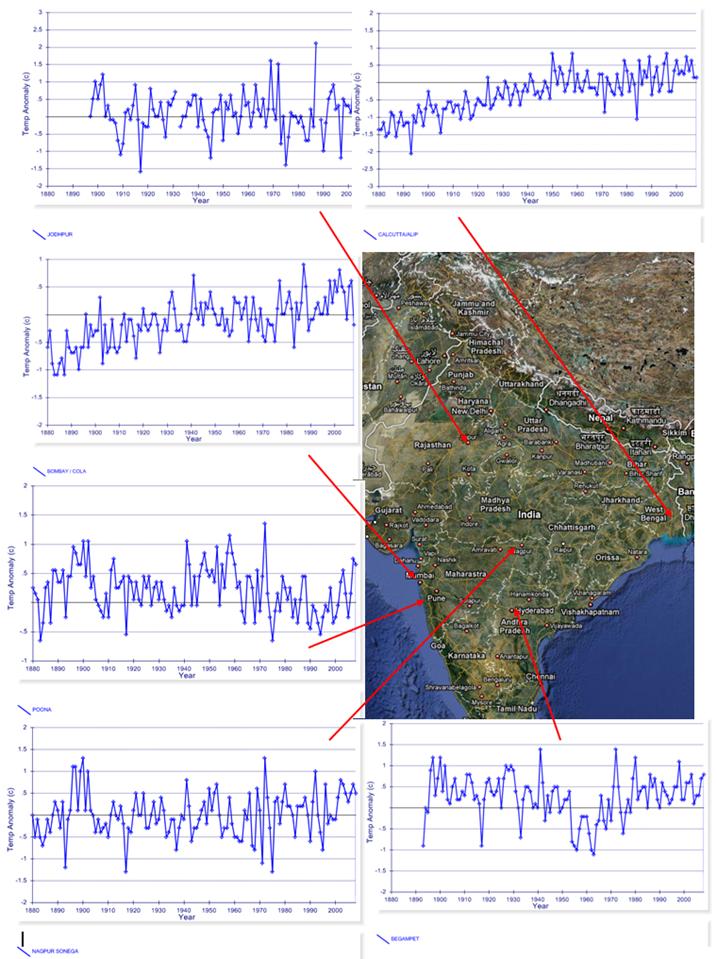
India has about 15 continuous long-term stations in the NOAA GHCN / NASA GISS climate database, as indicated on the following map.
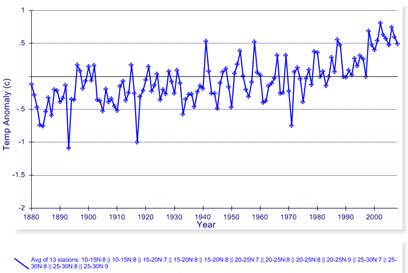
The following figure shows the annual average temperature anomalies from the Hadley Climatic Research Unit (HadCRU) data used by the IPCC for the 5x5 degree grids covering India (graph plotted at: http://www.appinsys.com/GlobalWarming/climate.aspx)
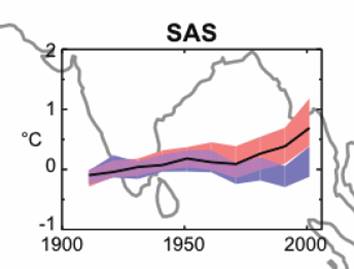
The following figure shows the 2007 IPCC AR4 temperature graph for the India area (from Fig. 9.12 [http://www.ipcc.ch/pdf/assessment-report/ar4/wg1/ar4-wg1-chapter9.pdf]). It shows the observed temperature anomalies (black line), along with the outputs of climate models including natural factors (blue band) and including anthropogenic CO2 (red band). The figure on the right superimposes the annual temperature anomaly data from above on the IPCC graph. From this graph it can be seen that the observed temperature is completely within the model band using natural climate forcings until the late 1970s.
The following figure shows the average annual temperature anomaly for several stations in India from the NOAA Global Historical Climate Network (GHCN). Most show no warming trends. Those that do, are high growth rate cities (Bombay, Calcutta) – and most of the temperature increase was prior to the 1970s when the IPCC says CO2 became a factor.
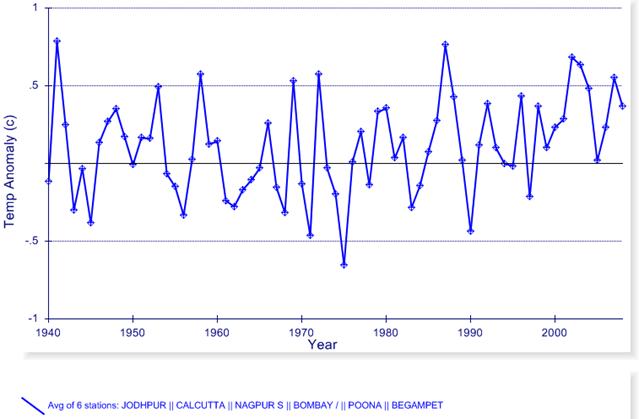
The following figure shows the average annual temperature anomaly of the above 6 stations from 1940 to 2008. This average includes Bombay (Mumbai) and Calcutta (Kolkata), which exhibit some urban warming.
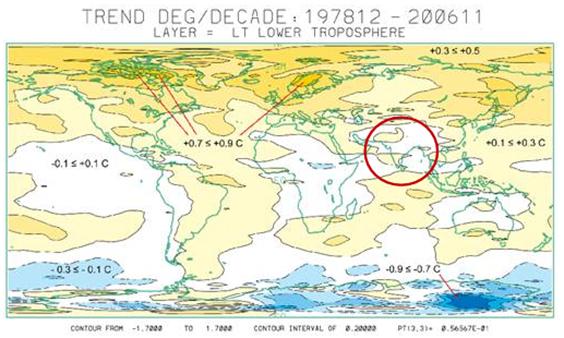
Global warming is not global. The following figure shows the global temperature change from 1978 to 2006 for the lower troposphere from UAH satellite data [http://climate.uah.edu/25yearbig.jpg]. India is highlighted in the circled area.
A 2004 study of temperature trends at Pune (labeled Poona in the graph above), (Gadgil and Dhorde: “Temperature Trends in Twentieth Century at Pune, India”) states: “The analysis reveals significant decrease in mean annual and mean maximum temperature. This decrease in temperature is more pronounced during the winter season, which can be ascribed to a significant increase in the amount of suspended particulate matter (SPM) in the ambient air during the last decade. On the contrary, monsoon season shows warming. This warming can be attributed to a significant increase in the low cloud amount.” [http://www.met.sjsu.edu/~wittaya/journals/TempTrendinIndia.pdf]
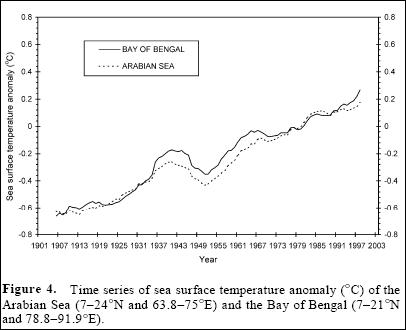
The following figure shows sea surface temperature anomalies around India – the warming began before CO2 was a factor [http://www.ias.ac.in/currsci/sep252007/782.pdf]
|
|
|
|
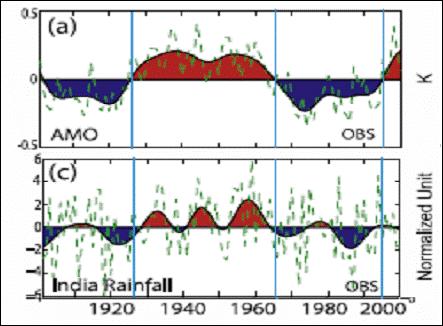
The Atlantic Multidecadal Oscillation (AMO) influences the monsoon rainfall in India. The following figure is from a study “Impact of Atlantic Multidecadal Oscillations on India/Sahel Rainfall and Atlantic Hurricanes” (Zhang and Delwoth, Geophysical Research Letters, Vol. 33, 2006) showing the correspondence between the AMO (a) and India rainfall (c). [http://www.gfdl.noaa.gov/reference/bibliography/2006/roz0603.pdf]
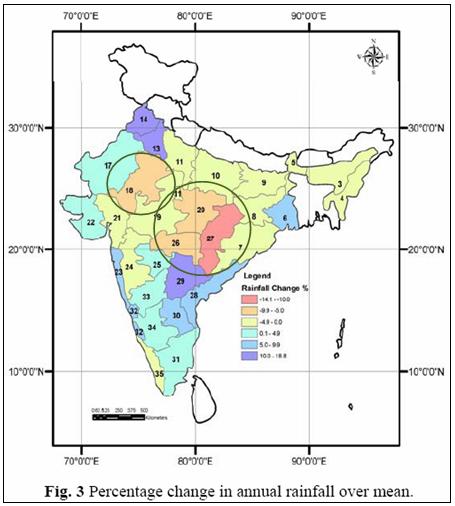
A 2007 study (Basistha, Goel, Arya and Gangwar: “Spatial Pattern of Trends in Indian Sub-Divisional Rainfall”) [http://www.nih.ernet.in/incoh-web/JVS/2007/paper4.pdf] examined the long-term rainfall trends for 1872 – 2005. The following figure is from their paper and shows the percentage change in rainfall from the long-term mean. The circled areas have had reduced rainfall – most areas have had increased rainfall.
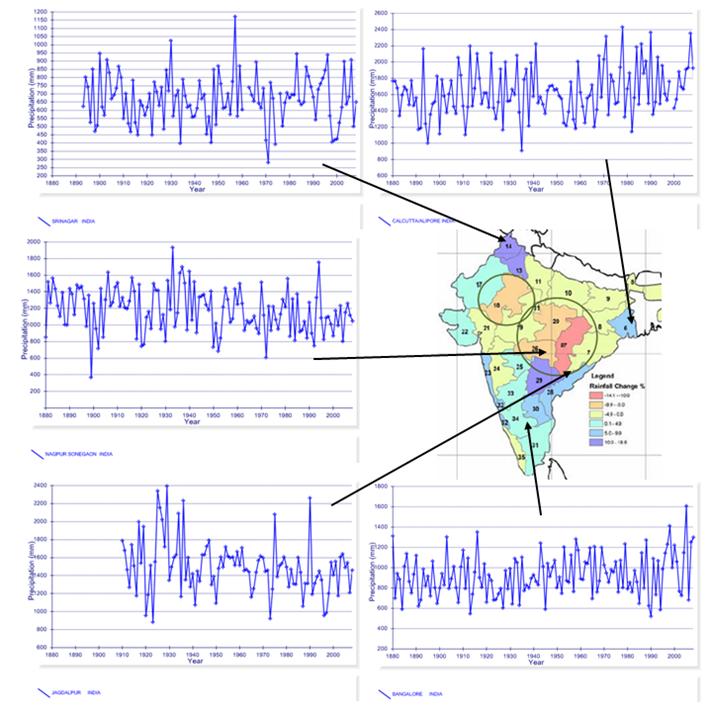
The following figure shows total annual precipitation for several stations in the NOAA GHCN database (plotted at: http://www.appinsys.com/GlobalWarming/climate.aspx)
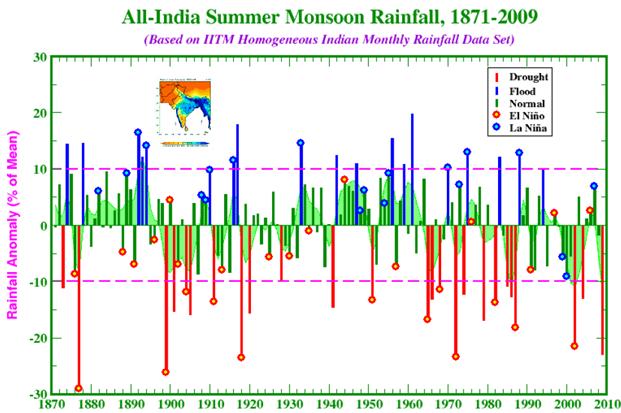
The following figure shows the monsoon season precipitation anomalies [http://moef.nic.in/downloads/others/Impact%20of%20CC_K%20Krishna%20Kumar.pdf]: “No long-term trend in all-India mean Monsoon Rainfall since 1871 - Epochs of above/below normal monsoon activity with a periodicity of approximately 3 decades”
|
|
|
|
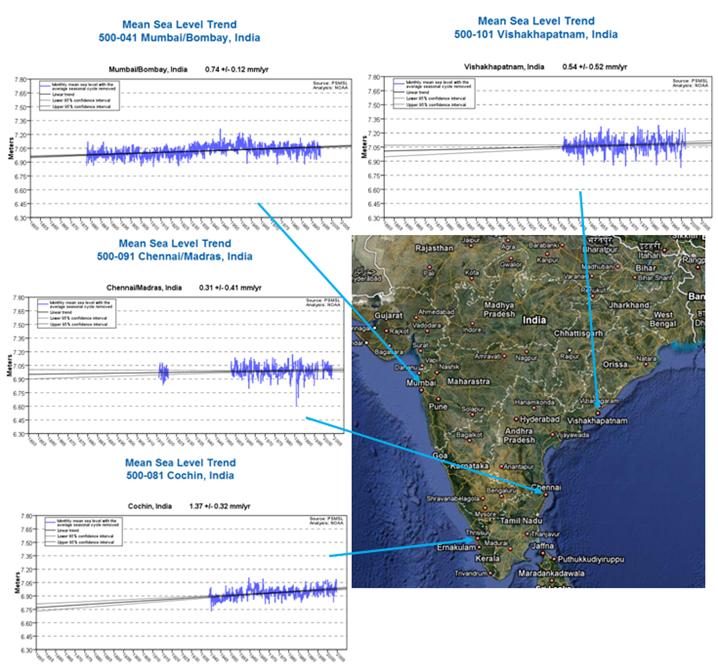
The following figure shows the only sea level stations in the PSMSL database (plots from NOAA http://tidesandcurrents.noaa.gov/sltrends/index.shtml). The sea level rise at these stations is below the global sea level mean trend.
|
|
|
|
The following figure shows a composite image showing retreat of the Gangotri Glacier terminus in the Garhwal Himalaya since 1780 [http://nsidc.org/glims/glaciermelt/index.html]
The Times of India reported the following (Mar 2008): “Contrary to what prophets of doom contend, that Gangotri will disappear in the next 30 to 40 years, some of India’s leading scientists believe there's no immediate or even medium-term threat to the glacier that feeds one of India's greatest rivers, Ganga. Gangotri's drawdown - 20 metres per annum in the '70s - is now mere six metres a year. Bhagirath Khadak in the Himalayas was retreating at 12 m annually but last year it didn't recede at all. Machoi in Jammu & Kashmir has showed no change since 1957. Same is true of Siachen and Kagriz in Ladakh, according to the Geological Survey of India. Even if Gangotri retreats at 20 m per annum, it will last for 1,500 years, according to V K Raina, chairman, Monitoring Committee on Himalayan Glaciology. "The discharge in Ganga had increased in 2001 when there was heavy snowfall. Raina, also a former deputy director general of GSI, said doomsayers have based their claims of a much shorter life of Gangotri on the basis of reduction in discharge of water from the glacier into the Ganga. But, he said, the glacier contributes only 25% to river discharge - the remaining 75% depends on snowfall and rainwater. This year, too, the snowfall's been heavy, hence the discharge will increase," he said. Not only the rate of retreat of Gangotri has decreased, in Leh, 123 years of temperature data shows a cooling of .04 degree per decade." [http://timesofindia.indiatimes.com/No_threat_to_Gangotri/articleshow/2892632.cms]
Evidence from the Siachen Glacier in the Himalayas indicates substantial decadal variation rather than a constant retreat due to global warming [http://www.ias.ac.in/currsci/aug102009/309.pdf].
The glaciers of the Karakoram area of the Himalayas have mainly been advancing in recent decades. “The Karakoram, lying immediately north of the western part of the greater Himalaya, is the highest of the southwest central Asian mountain systems. It has the largest concentration of glaciers on mainland Asia and outside high latitudes, with 8 glaciers over 50 km in length and more than 20 over 30 km. The perennial snow and ice cover, exceeding 16,000 km2, comprises a huge fresh water store in a generally arid, drought-prone region. Glacial meltwaters make a major contribution to the flow of the Indus and Yarkand Rivers and to the livelihood of some 130 million people.” [http://www.agu.org/eos_elec/97106e.html]
A report on Karakorum glaciers (Kenneth Hewitt – Cold Regions Research Centre, Wilfred Laurier University [http://www.wilsoncenter.org/events/docs/Hewitt_presentation.pdf]) states: “Most reports have mistakenly suggested that these glaciers are ‘disappearing’. Unlike the rest of the Himalaya … there has been no massive or even net reduction in the ice cover in the last three decades … more than 35 glaciers advancing, mid-glacier thickening in a dozen others”. The following “figure” shows what Hewitt says are “Misleading assessments? (to date, no evidence to support these assertions)” [false assertions indicated in yellow]:
And of course, global warming causes glaciers to grow as well as recede: “the region's [Western Himalaya, Karakoram, and Hindu Kush mountain ranges] winter snowfall, which feeds the glaciers, has been increasing. And average summer temperatures, which melt snow and glaciers, have been dropping. The combination of reduced summer melt and more winter snowfall could account for glacial growth, according to work to be published by Archer and colleagues in an upcoming issue of the American Meteorological Society's Journal of Climate.” [http://news.nationalgeographic.com/news/2006/09/060911-growing-glaciers.html]
A University of California – Irvine study shows that northern India groundwater reduction is due to overconsumption. “NASA hydrologists have found that groundwater beneath northern India has been receding by as much as 1 foot per year over the past decade - and they believe human consumption is almost entirely to blame. More than 109 cubic kilometers (26 cubic miles) of groundwater disappeared from the region's aquifers between 2002 and 2008 - double the capacity of India's largest surface-water reservoir, the Upper Wainganga, and triple that of Lake Mead, the largest manmade reservoir in the U.S. People are pumping northern India's underground water, mostly to irrigate cropland, faster than natural processes can replenish it.” [http://www.uci.edu/features/feature_indiagroundwater_090812.php]
See: http://www.appinsys.com/GlobalWarming/GW_4CE_Glaciers.htm for more info on glaciers in the Himalayas as well as other parts of the world.
|
|
|
|
Biomass and wood burning result in another type of emission – black carbon. “While carbon dioxide may be the No. 1 contributor to rising global temperatures, scientists say, black carbon has emerged as an important No. 2, with recent studies estimating that it is responsible for 18 percent of the planet’s warming, compared with 40 percent for carbon dioxide.” [http://www.nytimes.com/2009/04/16/science/earth/16degrees.html?_r=1] (An implication here is that climate models are overestimating the effects of CO2.)
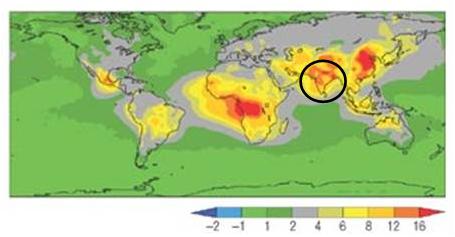
The following figure shows the atmospheric solar heating due to black carbon, indicating the regional areas of major black carbon emissions [http://www.nature.com/ngeo/journal/v1/n4/full/ngeo156.html]. India is highlighted in the circled area.
A 2002 study in Science (Menon, Hansen, Nazarenko and Luo: “Climate Effects of Black Carbon Aerosols in China and India” [http://www.sciencemag.org/cgi/content/abstract/297/5590/2250]) states: “precipitation and temperature changes in the model that were comparable to those observed if the aerosols included a large proportion of absorbing black carbon ("soot"), similar to observed amounts. Absorbing aerosols heat the air, alter regional atmospheric stability and vertical motions, and affect the large-scale circulation and hydrologic cycle with significant regional climate effects.”
See: http://www.appinsys.com/GlobalWarming/BiomassBurning.htm for more information on black carbon.
|
|
|