Global Warming Science - www.appinsys.com/GlobalWarming
Iceland
[last update: 2010/04/17]
|
Temperature
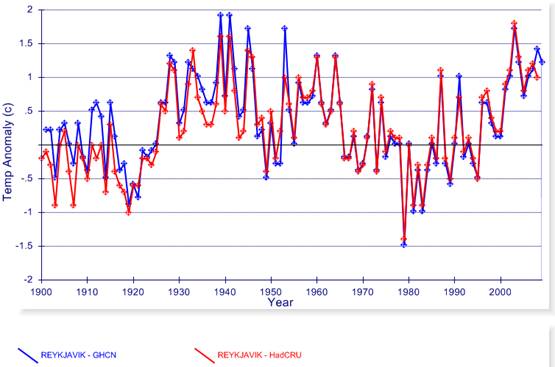
The following figures show the annual average temperature anomalies for Reykjavik and Akureyri – the only long-term stations in Iceland (plotted at http://www.appinsys.com/GlobalWarming/climate.aspx). The blue line shows the NOAA GHCN data; the red line shows the Hadley/UEA CRU (CRUTEM3) data. The main difference between GHCN and HadCRU is that the CRU has adjusted the data to slightly reduce the 1930s warming (which exceeds the 1990s warming). There has been no net warming over the last 80 years.
|
|
Atlantic Multidecadal Oscillation (AMO)
The Atlantic Multi-Decadal Oscillation (AMO) is a fluctuation in de-trended sea surface temperatures in the North Atlantic Ocean. It was identified in 2000 and the AMO index was defined in 2001 as the 10-year running mean of the detrended Atlantic SST anomalies north of the equator. The AMO has a cycle length of approximately 70 years (i.e. a warm phase plus a cold phase). The following figure shows the annual AMO from 1958 to 2006 [http://intellicast.com/Community/Content.aspx?a=127]
The AMO affects regional temperatures in the Arctic area of the northern Atlantic. The following figure shows the temperature anomalies for Reykjavik and Akureyri (from the NOAA GHCN database). The next figure compares the temperature data with the AMO shown previously. There is a strong correlation between the two. This shows that CO2 is not driving temperatures in Iceland, since the AMO is calculated from de-trended ocean data.
See: http://www.appinsys.com/GlobalWarming/AMO.htm for more info on the AMO.
|
|
Sea Ice
The following figure shows Icelandic sea ice since 1880. The current reduction in sea ice is not unprecedented – it was lower in the 1930s – 1940s. The long term trend has been a decline since the 1800s – i.e. since the Little Ice Age. [http://www.acia.uaf.edu:16080/PDFs/ACIA_Science_Chapters_Final/ACIA_Ch06_Final.pdf]
|
|
Glaciers and Volcanoes
“Iceland is a glaciated country. Approximately 11% of Iceland’s total area of roughly 100.000 km2 is covered by glaciers (Figure 1). The largest ice caps in Iceland are located in the southern and central highlands. … The largest ice cap is the great Vatnajökull, the largest glacier mass in Europe. It covers an area of roughly 8000 km2, and is 950-1000 m where it is thickest. Its mean thickness is a little less than 500 m, and the total ice volume of Vatnajökull is probably in the order of 3300 km3 … A number of large volcanoes are covered by the great ice cap, including Öræfajökull (2119 m), Bárðarbunga (2020 m) and Grímsvötn.” [http://notendur.hi.is/oi/icelandic_glaciers.htm]
Iceland straddles the Mid-Atlantic Ridge where the North American and the Eurasian Plates are separating: “Iceland is splitting along the spreading center between the North American and Eurasian Plates, as North America moves westward relative to Eurasia.” [http://pubs.usgs.gov/gip/dynamic/understanding.html] The following figure from this source shows active volcanoes (red triangles).
The following figure shows an elevation view of Iceland “The inserted geological map shows the active volcanic zone and the central volcanoes.” [http://www.raunvis.hi.is/~fp/Jokull2008HBFP.pdf]
Also from the above source: “The regional distribution of glaciers in Iceland indicates how precipitation arrives with prevailing southerly winds. … the largest icecaps are situated in the southern and central highlands. On top of the larger icecaps, average temperatures are below or close to freezing throughout the year, with most of the precipitation falling as snow.” The following figure shows annual precipitation.
http://www.volcanodiscovery.com/en/iceland.html
The Breidamerkurjokull is one of the main outlet glaciers from the Vatnajokull ice cap. The following figure shows the recession of Breidamerkurjokull from 1903 to 1980, with the progression of the development of the outflow lakes and rivers. [http://www.vegagerdin.is/vefur2.nsf/Files/2005_strandrof_strandvarnir_Breidamerkurs/$file/Coastal%20erosion%20and%20coastal%20protection%20near%20the%20bridge%20across%20J%C3%B6kuls%C3%A1%20river,%20Brei%C3%B0amerkursandur,%20Iceland.pdf]
Not unprecedented: “land which is now largely hidden by Breiðamerkurjökull was vegetated and even occupied by several farms. Then the second outstanding period of icecap expansion during Neoglaciation set in, called the Little Ice Age and destined to last from the Middle Ages till the close of the 19th century. During this period, some glacier outlets advanced around 10–15 kilometres, devastating vegetation along with several farms. The firn line in southern Iceland crept down from 1,100 to 700 m in the latter part of the Little Ice Age” [http://www.raunvis.hi.is/~fp/Jokull2008HBFP.pdf]
A 2000 article in CNN.com (“Europe’s Biggest Glacier Shrinks”): "The glacier has been shrinking for most of the 20th century," Dr David Evans, of Glasgow University's Geography and Topographical Science Department, told CNN.com. … But he dismisses panic theories that the loss of the glacier is man-made or even permanent. "It really is not a human-induced situation," he said. "This glacier is receding from the coast because it advanced to the coast during what is known as the Little Ice Age. Relatively speaking, things have become warmer, but they were warm before the Little Ice Age." … Evans says that 300 years ago the coastal land around Breidamerkurjokull was ice-free and used for farming by local people. Then, in the early decades of the 18th century, the climate grew colder and giant rivers of ice spread out from the Vatnajokull sheet, including the Breidamerkurjokull glacier. These moved miles down to the coast, covering pastures and crushing farmhouses that lay in their path. "The Little Ice Age lasted almost 200 years, reaching its peak, in Iceland, in 1890, when Breidamerkurjokull got closest to the sea," said Evans. "That mini-ice age is over now, and the climate has been getting warmer for the past 100 years. Hence the shrinking and disintegration of the glacier. What we are seeing now is more to do with natural evolution than global warming. … "Breidamerkurjokull still has to go quite a long way back yet to get to where it was prior to the Little Ice Age," said Evans.” [http://archives.cnn.com/2000/WORLD/europe/10/23/iceland.glacier/]
|
|
The Alarm
“Ice cap thaw may awaken Icelandic volcanoes” [http://www.scientificamerican.com/article.cfm?id=ice-cap-thaw-iceland-volcanoes] “A thaw of Iceland's ice caps in coming decades caused by climate change may trigger more volcanic eruptions by removing a vast weight and freeing magma from deep below ground, scientists said on Friday. … a 2008 paper in the scientific journal Geophysical Research Letters about possible links between global warming and Icelandic volcanoes. That report said that about 10 percent of Iceland's biggest ice cap, Vatnajokull, has melted since 1890 and the land nearby was rising about 25 millimetres (0.98 inch) a year, bringing shifts in geological stresses.” (Make no mistake – when the “Scientific” American refers to “climate change” or “global warming”, they mean anthropogenic greenhouse gas caused warming.)
The stupidity of these people (as reported at the alarmist “Scientific” American) – a glacier sitting on top of the Mid-Atlantic Ridge in the most volcanically active area of the world will cause more volcanic eruptions from melting due to human CO2 caused warming – when it was just as warm before the Little Ice Age, and warmer in the 1930s! The area is a volcanic hotspot with constant upwelling of magma!
The BBC reports: “Offshore volcanic activity has resulted in the formation of separate volcanic islands, one of which, Surtsey, appeared as recently as 1963.” [http://news.bbc.co.uk/2/hi/europe/8623239.stm] Obviously active volcanoes often cause uplifting – but the “scientists” in the SA article above attribute it to a melting icecap due to global warming.
Scientific American (above): “possible links between global warming and Icelandic volcanoes. That report said that about 10 percent of Iceland's biggest ice cap, Vatnajokull, has melted since 1890”. NYTimes [http://www.nytimes.com/2006/01/17/science/17icel.html] “In 1996, an eruption beneath the Vatnajokull ice cap, Europe's largest ice mass, led to a jokulhlaup that forced sediment, meltwater and ice out along the 12-mile stretch of the glacier's edge. The flow of water out of the glacier created a river to rival the Amazon in size, at least for a few minutes.” Global warming? More likely the volcanoes.
The United Nations is, of course, also promoting this bogus scare story. The following figure is from a UN report with the caption “Vertical movement of land in Iceland. Much of the interior and the south eastern coast are experiencing uplift due to glacier thinning” The UN report states: “The thinning of large glaciers, such as the Vatnajökull ice cap, one of Europe's largest ice masses, reduces the load on the Earth's crust which rebounds. Consequently large parts of Iceland are now experiencing uplift.” [http://unfccc.int/resource/docs/natc/isl_nc5_resubmit.pdf]
Notice the areas of maximum uplift – on the Grimsvotn volcano beneath the Vatnajokull glacier, and between the glaciated areas – still volcanically active.
“Grimsvötn volcano is situated near the center of the Vatnajökull ice cap in central Iceland and is one of Iceland's most active volcanoes. It has a complex of calderas and a subglacial caldera lake sustained by geothermal heat. … the Grimsvötn centre is a part of a a fissure system which includes the Laki fissure, which in 1783 produced about 12-14 km3 of basaltic lava. Within the ice filled Grimsvötn caldera intense geothermal activity continuously melts the ice to form a subglacial lake, which at intervals of 5 to 10 years is emptied along subglacial channels to create large floods (jökulhlaup) on the sandur plain, Skeidararsandur, on the Icelandic south coast.” [http://iceland.vefur.is/iceland_nature/Volcanoes_in_Iceland/grimsvotn.htm]
A 2006 study in the Journal of Geophysical Research states “We observe large-scale crustal deformation due to plate spreading across Iceland. … The plate boundary deformation field has been locally and temporarily affected in south Iceland by two M w = 6.5 earthquakes in June 2000, inflation at Katla volcano during 2000 to 2004, and an eruption of Hekla volcano in February 2000. All stations with significant vertical velocities are moving up relative to the reference station REYK, with the highest velocity exceeding 20 mm/yr in the center of the island.” [http://www.agu.org/pubs/crossref/2006/2005JB003717.shtml]
“On average, a volcano erupts about every 5 years. Eleven volcanoes have erupted between 1900 and 1998: Krafla, Askja, Grimsvotn, Loki-Fogrufjoll. Iceland was buried under ice in the last Ice Age and all eruptions were subglacial. Remnants of the ice caps remain and Iceland continues to have numerous subglacial eruptions. Of the world's known subglacial eruptions, 83% are in Iceland. The most recent eruption, at Grimsvotn, is an example. Subglacial eruptions produce a special type of volcano, called a table mountain or a moberg mountain. Great volumes of meltwater, generated by subglacial eruptions, can burst out from beneath glaciers to produce enormous floods called jokulhlaup. The discharge can be as much as 20 times greater than the flow rate of the Amazon River.” [http://www.natureexplorer.is/home/about-iceland/geology-of-iceland/]
A study of the crustal structure (including the following figure) [www.episodes.org/backissues/33igc/12-2new.pdf] states: “Recent seismic data argue for a thick relatively cold crust under Iceland, with crustal thickness increasing from c. 15 km in the coastal areas towards c. 40 km under central Iceland, with clear seismic reflections originating from a Moho. A fully three-dimensional study of the crustal structure of Iceland by Allen et al. (2002), based on a combination of surface wave and body wave data, as well as constraints from gravity data, gives a map of crustal thickness (Figure 4). There is little contrast in density between crust and mantle (Gudmundsson, 2003), and the large crustal thickness is consistent with high melt production in a mantle plume under Iceland.”
It seems the alarm is sounded every few years. The Guardian in 2000: [http://www.guardian.co.uk/environment/2000/oct/22/weather.climatechange]
This is how confused the alarmists are. It is physically impossible for it to “break apart and slide into the Atlantic” – it melts and the tip breaks into icebergs in the lake formed at the terminus.
Europe’s largest glacier is the Vatnajokull ice cap, not the Breidamerkurjokull which is the largest outlet glacier from Vatnajokull. (Breidamerkurjokull has been receding since 1903 when observations were first recorded, as documented previously). The Guardian, by phrasing it this way “Europe’s biggest glacier is about to disintegrate”, is telling a lie to promote the bogus scare.
(Norway’s Jostedalsbreen is the largest glacier in continental Europe. Or perhaps not – according to the UNESCO World Heritage “The Jungfrau-Aletsch-Bietschhorn region [Switzerland] is the most glaciated part of the European Alps, containing Europe's largest glacier [Aletschgletscher]”)
Here is Breidamerkurjokull in 2010 (from Google maps 2010-Apr-17):
Here it was in 1973 and 2000 [http://www.na.unep.net/atlas/webatlas.php?id=118] :
The following compares the 2000 view from above-right (UNEP) with the 2010 view (Google maps).
The UNEP article states: “During much of the 20th century, Iceland's Breidamerkurjökull Glacier has been shrinking. It has been studied extensively since 1903, when researchers drew up detailed maps which showed that its base is just a few hundred metres from the ocean edge. Over time, the glacier has receded so that its base is now several kilometers from the coast. As the huge river of ice pulled back across the Icelandic landscape, thousands of hectares of fertile farmland have been exposed, and people are populating the area that was until recently buried under tonnes of ice.” Sounds like good news – more useable land.
|
|
|