Global Warming Science - www.appinsys.com/GlobalWarming
Florida, USA
[last update: 2010/03/22]
|
Temperatures
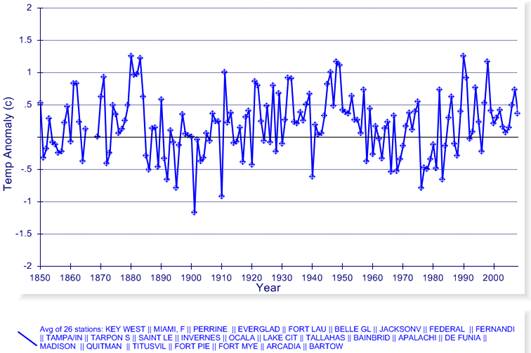
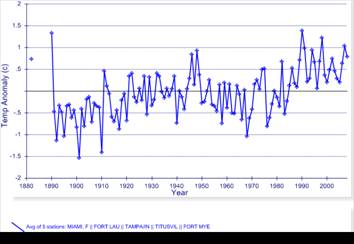
Florida is in a region of the United States that exhibits no substantial long-term warming. The following figure shows the temperature anomalies for 1850 to 2008 for the average of all 26 stations in Florida in the NOAA Global Historical Climatology Network that have data prior to 1930 and after 2000. The last 10 years have been well within the normal long-term range. Florida is not exhibiting unprecedented warming.
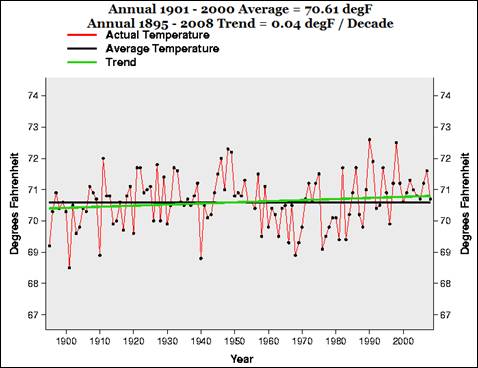
The following figure shows the Florida average annual temperatures from 1895 to 2008 from the National Climatic Data Center [http://www.ncdc.noaa.gov/oa/climate/research/cag3/fl.html]. It shows a similar pattern to the HadCRU data shown above. Although there has been some warming since the mid-1960s, the last 9 years have been close to the long-term mean.
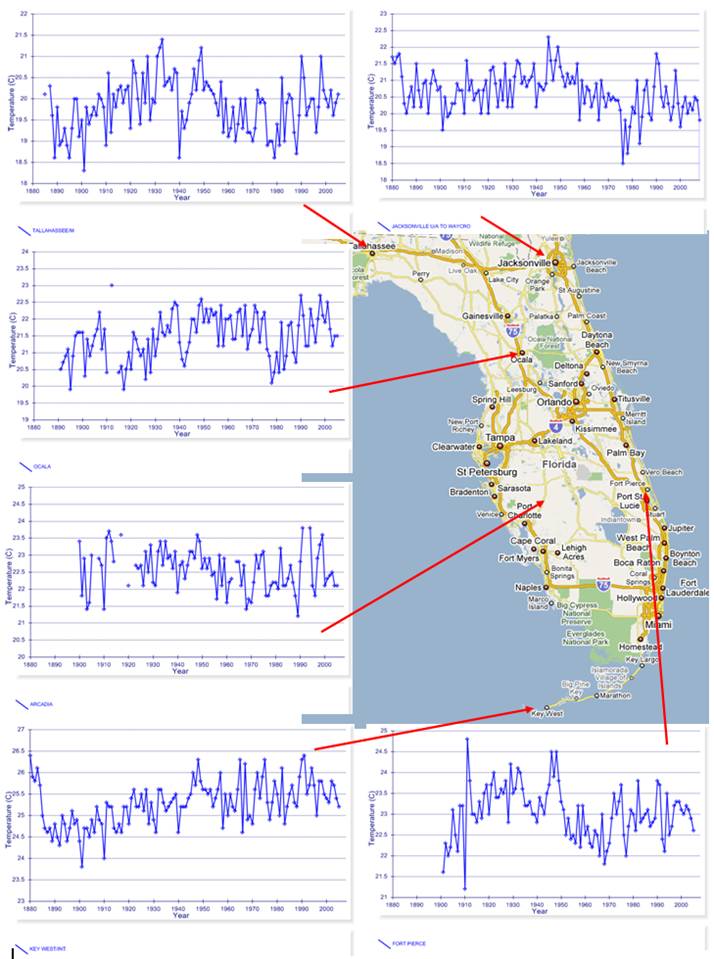
The following figure shows the annual mean temperatures from 1880 to 2008 for several of the long-term temperature stations in Florida from the NOAA Global Historical Climate Network.
|
|
Urban / Rural Differences and Land Use Change
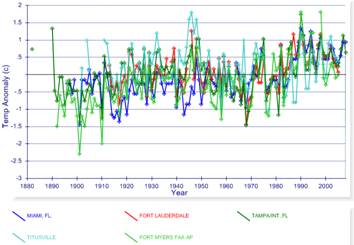
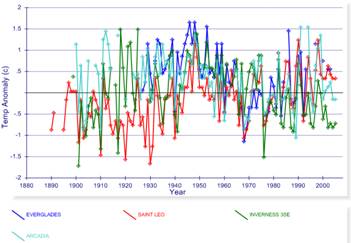
The following figures show the difference between urban and rural stations in southern Florida (from Orlando south). These figures show annual average temperature anomalies from the NOAA GHCN database. Urban areas exhibit more warming than rural areas.
Urban stations: Miami, Ft. Lauderdale, Tampa, Ft. Myers, Titusville (left), average of these (right)
Rural stations: Everglades, Arcadia, St. Leo, Inverness (left), average of these (right)
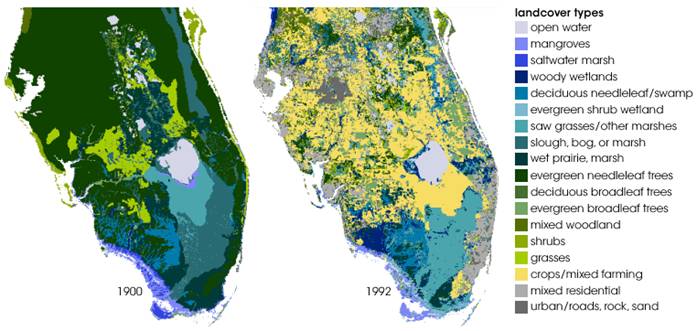
There is much greater variation in the rural stations as can be seen above. This is due to other land use change that has affected some rural locations. The following figure shows the change in land cover types from 1900 to 1992 [http://earthobservatory.nasa.gov/Features/DeepFreeze/printall.php] (This link describes a study of changes in land use patterns resulting in climate changes in Florida.)
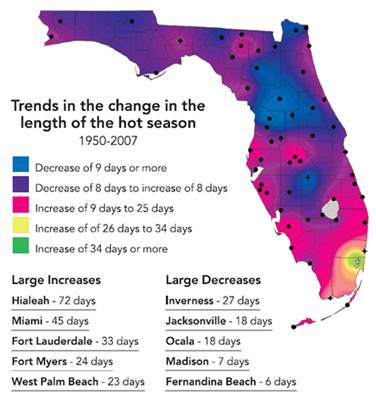
A study of Florida’s climate by Florida State University Professor Morton Winsberg [http://www.floridatrend.com/article.asp?aID=74738929.7299137.655837.79720802.29349702.748&aID2=50440] showed that: “the hot season in Florida has gotten a lot hotter — and longer — in some places, but not at all in others. The change, however, is unrelated to global warming … it’s a function of the lesser-known phenomenon of local warming. … the most notable climate changes along the state’s southeastern coast, where development and wetlands drainage have been heaviest … Winsberg and FSU meteorologists to blame the hot spots on local land-use changes that accentuate the urban “heat-island” effect — the pools of heat that large, dense concentrations of people produce in their local climates. Cutting down trees, draining wetlands and pouring concrete all make a place hotter”.
The following figure is from the above article. The large population growth urban areas are the ones experiencing increasing hot season.
|
|
Atlantic Multi-Decadal Oscillation (AMO)
Florida’s climate is also by the Atlantic Multi-decadal Oscillation (AMO) (See http://www.appinsys.com/GlobalWarming/PDO_AMO.htm for more information on the AMO).
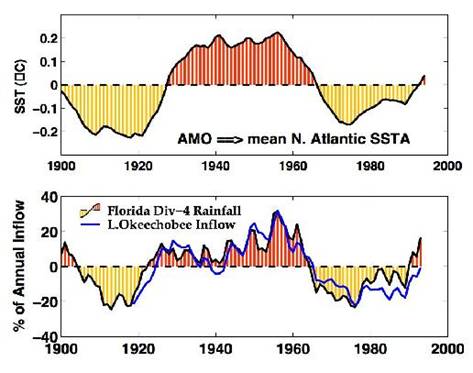
The following figure is from the NOAA AMO web site [http://www.aoml.noaa.gov/phod/amo_flarain.php]. The upper figure shows the AMO index since 1860, while the lower figure shows the smoothed anomaly of central Florida rainfall (shaded curve) and the amount of water flowing into Florida Lake Okeechobee. This shows the correlation between the AMO and the rainfall in Florida.
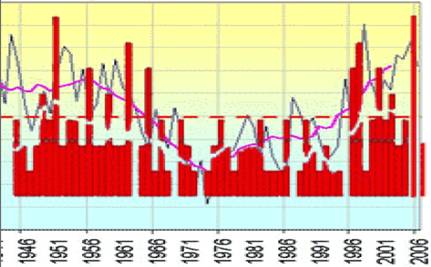
The following figure compares the number of major Atlantic hurricanes (red bars) with the annual AMO (black line) and the smoothed AMO (magenta line) [http://www.intellicast.com/Community/Content.aspx?a=127] This shows the strong correlation between the AMO and hurricanes.
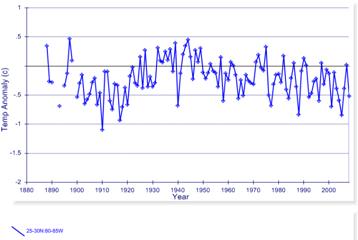
The following figure compares the average temperature anomalies for 26 stations shown previously with the AMO. There is a very good correlation between them except during 1900 – 1920.
|
|
Sea Surface Temperatures
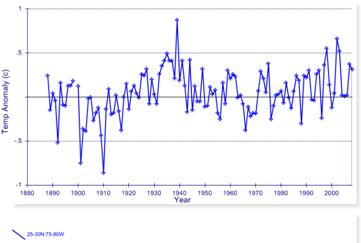
The following figures show the annual average sea surface temperature anomalies to 2008 for Florida. (from the Hadley Climate Research Unit HadSST2 database plotted at http://www.appinsys.com/GlobalWarming/climate.aspx) The figures show [left] Gulf SST in the 25-30Nx80-85W grid, and [right] Atlantic SST in the 25-30Nx75-80W grid. The Gulf coast exhibits a cooling trend for the last 60 years, whereas the Atlantic coast has warming since 1970.
|
|
Precipitation
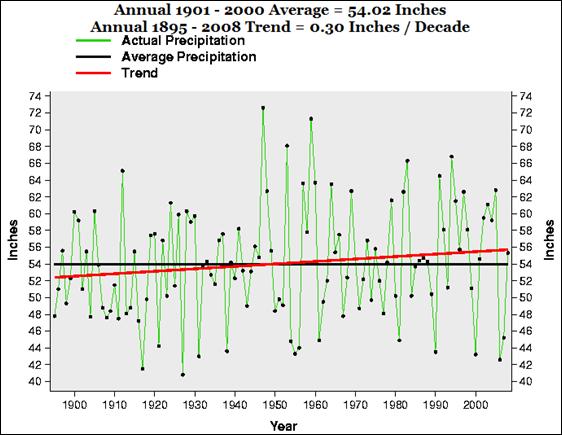
The following figure shows the Florida total annual precipitation from 1895 to 2008 from the National Climatic Data Center [http://www.ncdc.noaa.gov/oa/climate/research/cag3/fl.html]. No drought trend.
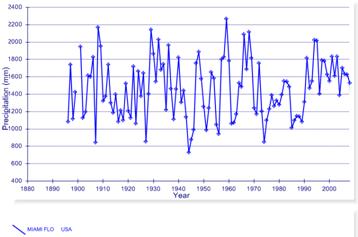
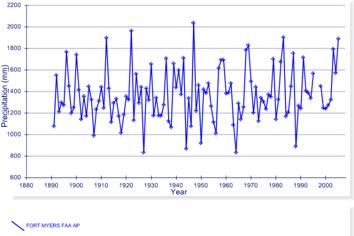
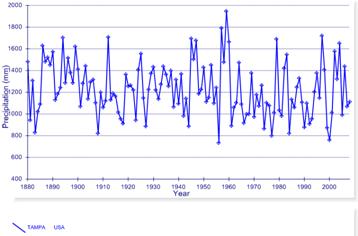
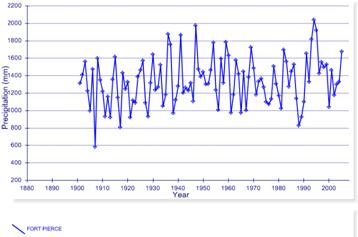
The following figures show total annual precipitation from 1880 to 2008 for a few locations in Florida from the NOAA GHCN database. No sign of a drought trend here, although the LA times reported about Florida Governor Crist’s speech: “Crist told about 600 participants of the conference that Florida already is feeling harmful effects from global warming Due to declining rainfall, parts of Florida” [http://articles.latimes.com/2007/jul/13/nation/na-climate13]
Miami: Fort Myers:
Tampa: Fort Pierce:
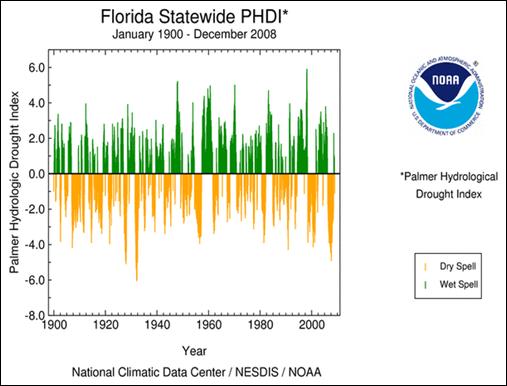
The following figure shows the Palmer Hydrological Drought Index for Florida since 1900 [http://www.ncdc.noaa.gov/img/climate/research/2008/dec/Reg008Dv00_palm06_01001208_pg.gif]. There is no change in drought pattern observed.
|
|
Sea Level
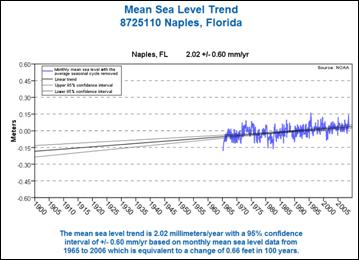
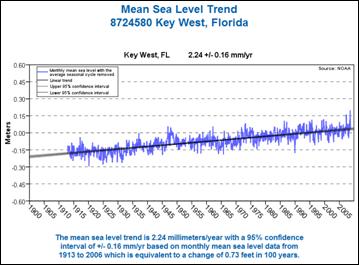
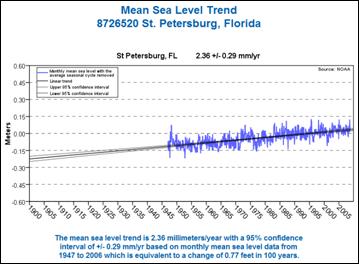
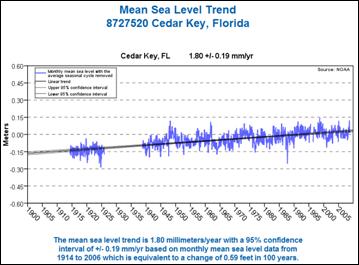
One of the big alarmist scares is that Florida will disappear due to rising sea levels. The data tell a different story. The following figures show historical sea level tends for stations in Florida from the NOAA database [http://tidesandcurrents.noaa.gov/sltrends/index.shtml] (Key West is the only location that has more than 80 years of data in the database).
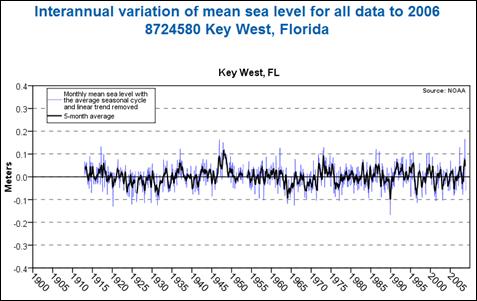
One of the significant points of this sea level data is that the rate of increase has not changed since measurements began – around 1912 in the case of Key West. The following figure shows the interannual variation of sea level change for Key West. This is significant since the IPCC states that anthropogenic CO2 effects only show up after 1970, and yet there is no change in the rate of sea level rise.
|
|
Manatees
Of course reality doesn’t affect environmental groups’ propaganda. For example, the “Defenders of Wildlife” states: “Since manatees spend their live in the water, global warming poses significant threats to their well-being. Higher water temperatures along the Gulf Coast has lead to an increase in toxic algae blooms, such as the red tide that killed more than 150 manatees in 1996.” [http://www.defenders.org/wildlife_and_habitat/wildlife/manatee.php#]
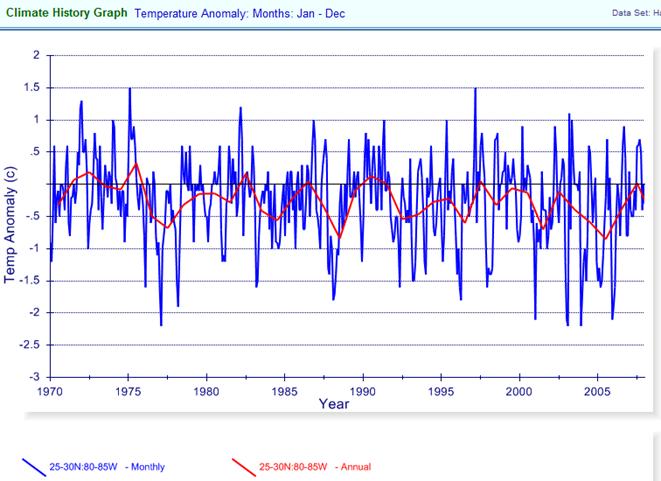
The following figure shows the sea surface temperature anomalies for the 5x5 degree grid covering Florida’s Gulf Coast for 1970 – 2008 (monthly data – blue, annual average – red). A distinct cooling trend contradicts the “Defenders” propaganda.
The 1996 mortality episode referred to by the “Defenders” is described by the “Save the Manatee Club” as: “The red tide epizootic began on March 5 and continued through April 28 along Florida's southwest coast, wiping out approximately 15% of the known west coast population of manatees. … In 1982, another outbreak of red tide was believed to have contributed to the death of 37 manatees. Over the years however, red tide manatee mortality events have been rare. Red tide is considered to be a natural event” [http://www.savethemanatee.org/faqmortality.htm]
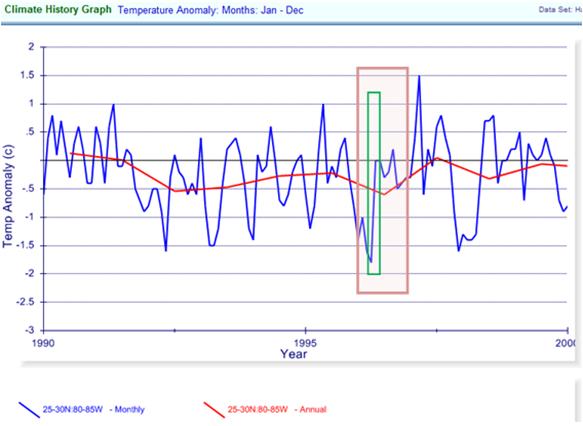
The following figure shows the same data as above for 1990 – 2000. The 12 months of 1996 are highlighted by the pink box, while the March – April red tide episode is highlighted by the green box.
According to the Fish and Wildlife Research Institute, salinity was the factor, not temperature: “Red tides do not usually appear inshore during the winter/spring months when manatees are congregated in low- or zero-salinity areas in the warmer waters of the coastal power plants, at warm water spring refugia, or in residential canals. Unusually, in the winter/spring of 1982 and 1996, red tide encroached inside the barrier islands of southwest Florida. High-salinity areas (above 24 ppt) allowed persistently high concentrations of K. brevis [red tide] cells to be maintained.” [http://research.myfwc.com/features/view_article.asp?id=5964]
Environmentalists don’t let actual data get in the way of their propaganda, however.
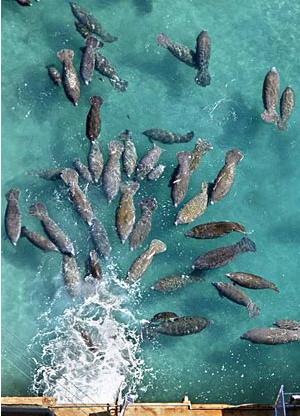
AGW alarmists would like to shut down all power plants, yet “An offline Florida power plant is providing a warm-water refuge for several hundred manatees who like the Sunshine State's human residents are shivering in record low cold temperatures. … The oil- and gas-fired plant was taken off line last year for modernization but [Florida Power and Light] FPL has installed a special heating system to keep waters at an attractively balmy temperature for the manatees” [http://planetark.org/enviro-news/item/56265] The LA Times showed the following picture of manatees using the warm water output from a power plant to survive. “More than 200 manatees are wintering in a balmy canal outside a power plant, the latest exotic Florida animals seeking refuge from the state's frigid temperatures. Giant eagle rays and spinner sharks joined them in the 70-degree waters Thursday as onlookers watched them frolic near Apollo Beach. With temperatures up to 20 degrees below normal, some less resourceful animals needed help from humans to survive.” [http://latimesblogs.latimes.com/unleashed/2010/01/warm-water-surrounding-florida-power-plant-is-a-spa-for-chilly-manatees-sharks-and-rays.html]
A study of Florida’s manatees and power plants (“Laist and Reynolds “Florida Manatees, Warm-Water Refuges and an Uncertain Future”, 2005 [http://mmc.gov/reports/publications/pdf/floridamanatees.pdf]) states: “Most Florida manatees depend on localized warm-water refuges in the southern two-thirds of Florida to survive winter; about 60% use outfalls from 10 power plants. Future availability of these refuges is in doubt; most of these power plants may be retired within the next 20 year … plant retirements may increase cold-stress-related deaths and significantly decrease manatee abundance. … All power plant outfalls now used by manatees were built between the 1940s and early 1970s. Many of these plants have reached or are approaching the end of their planned operational lives and soon may be retired. Since they were built, regulations under the U.S. Clean Water Act have prohibited new facilities from discharging effluent substantially warmer than the receiving waterbodies. The older, pre-existing plants, however, were granted variances allowing them to continue discharging warm water. Unless the older units are “repowered,” an expensive process of updating or replacing existing generating units with more efficient units, their retirement in the next 10 to 20 years will eliminate discharges on which most Florida manatees now depend for winter survival.”
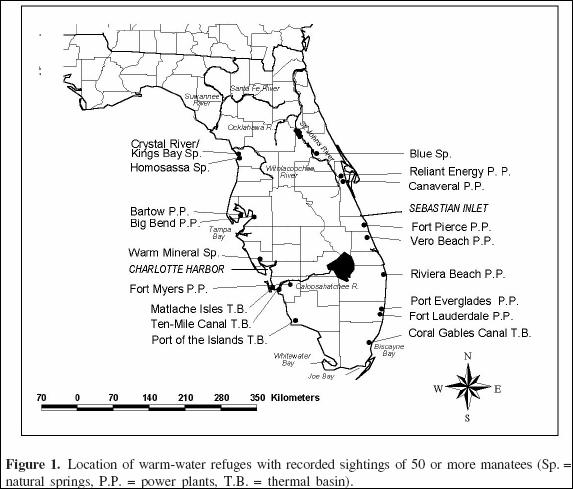
The following figure shows the location of the power plants that the manatees rely on for survival (from the above cited report).
The above report states: “As most power plants now used by manatees had not yet been built at that time [1950], some assume that, if power plants were closed, manatees would simply move south to warmer areas in Florida with no effect on overall manatee abundance. Such assumptions, however, may be overly simplistic and largely incorrect. Based on site-fidelity to winter refuges and manatee responses to past outfall shut-downs, it seems questionable, if not doubtful, that all or even many manatees would move to southernmost Florida or to natural springs that lie outside of their familiar range.”
Perhaps the pro-AGW environmentalists will just claim that the manatees are an “invasive species” and should be allowed to succumb to the cold.
See: http://www.appinsys.com/GlobalWarming/Manatees.htm for more details.
|
|
Coral Reefs
The cold weather [January 2010] has been killing coral and causing “coral bleaching” in Florida. See: “Cold kills coral; 1st time since 70s” [http://keysnews.com/node/20365] “A cold-water bleaching and die-off hasn't occurred in Florida since the late 1970s Former sanctuary superintendent and 39-year Keys resident Billy Causey vividly recalled the damage from the winters of 1977 and 1978, when he saw "light flurries" of snow in Big Pine Key … He fears the long-term effects of the recent cold snap, which lasted much longer than the previous event, when Keys corals were much healthier than today. Years of pollution, overfishing and global warming have taken their toll, he said. Since (1977), our corals have been struggling," Causey said. "Our corals were just starting to see recovery”.”
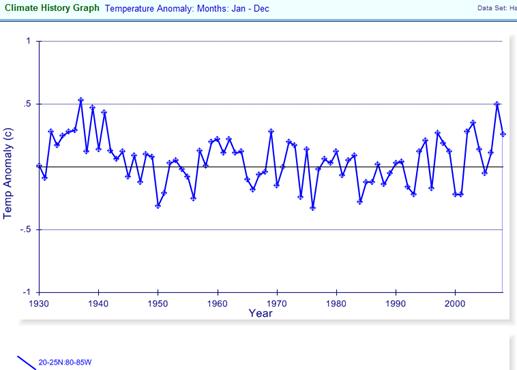
It is interesting that while alarmists have been blaming coral declines on global warming, in the Keys “corals were just starting to see recovery” until the 2010 cold weather arrived. The following figure shows the average annual sea surface temperature (SST) anomalies for the 5x5 degree grid encompassing the Florida Keys (from the CRU HadSST2 data plotted at http://www.appinsys.com/GlobalWarming/climate.aspx) for 1930 – 2008. Note that “Our corals were just starting to see recovery” with the recent warming trend over the last decade.
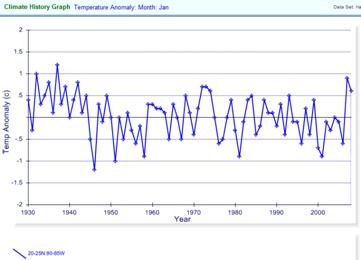
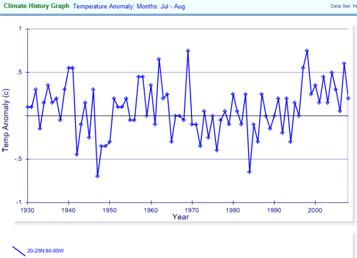
The following figures show the same data as above but limited to the month of January (left) and the July-August average (right).
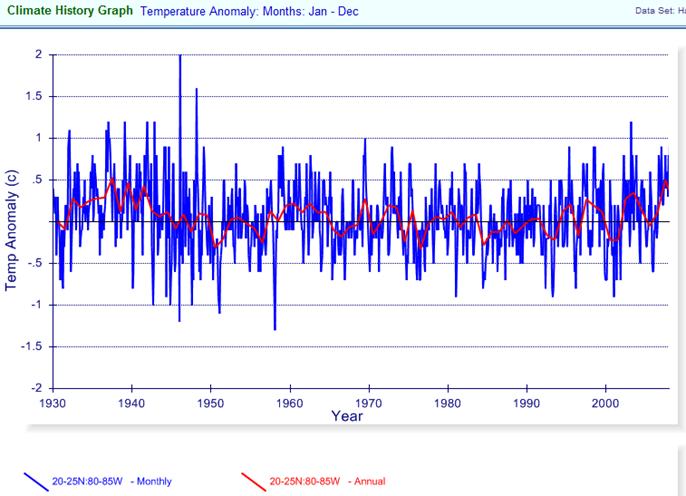
The following figures show the same data as above but including monthly data (blue) as well as annual average (red). The 1930s were warmer than recent temperatures.
|
|
|
