Baltic
Sea Area
This is part of the Regional Summary series at www.appinsys.com/GlobalWarming
![]()
The Baltic Sea area has very few long-term stations in the GHCN database – and most are urban. The Baltic Sea area is interesting since it is a sea in the northern hemisphere with the countries to the north reaching the Arctic Circle. According to the CO2 theory, this mid-to-high latitude location is the area where the warming should be most pronounced. However, the area is not exhibiting warming that exceeds the 1930s, and thus does not match the models.
The following figure shows all of the available long-term temperature stations in the area.
The following figure shows the available long-term sea level stations in the area.
A recent article (Hansson, D. and A. Omstedt. 2007: “Modelling the Baltic Sea Ocean Climate on Centennial Time Scale: Temperature and Sea Ice”, Climate Dynamics, DOI 10.1007/s00382-007-0321-2) [
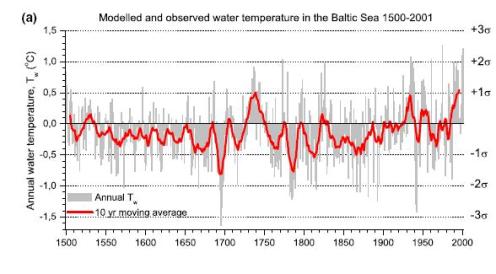
http://www.springerlink.com/content/38218106v2gwq380/] provides reconstruction of sea temperatures and sea ice. The authors state: “It appears that the late twentieth century warming in the Baltic Sea region cannot be determined to be unprecedented over the past 500 years, as the mid-eighteenth century warming is of comparable magnitude.”
The following figure is Figure 2 from their paper, showing reconstructed water temperatures of the Baltic Sea from 1500 to 2001. They state: “From 1935 to the present no statistically significant water temperature trend can be determined.”
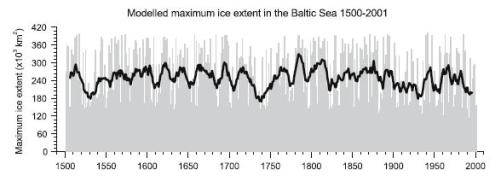
The following figure is from Figure 3 from their paper, showing reconstructed and modeled maximum ice extent of the Baltic Sea. They state: “The 1730s is the decade with the least ice, followed by the 1740s and the 1930s. …Bearing in mind that the LIA, with a generally colder climate, ended in the 1870’s” any reduction in sea ice in the century that followed would be expected.”
Finland
The following figure shows Finland along with rectangles representing the four 5x5 degree grids covering most of the country. The upper graph shows the annual temperature anomaly data for the four 5x5 degree grids from the Hadley Climatic Research Unit, which provides data to the IPCC. Recent temperatures are similar to the 1930s. The lower graph shows the annual mean temperature data from the NOAA GHCN database for Helsinki.
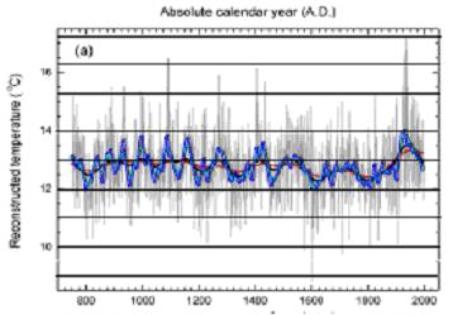
A recent presentation at a tree ring conference presented work on Finland summer temperatures, conducted by three scientists from the Finnish Forest Research Institute and the University of Helsinki (Timonen, M., Mielikäinen, K., and Helama, S. 2008. Climate variation (cycles and trends) and climate predicting from tree-rings. Presentation at TRACE 2008: Tree Rings in Archaeology, Climatology and Ecology, April 27-30, Zakopane, Poland) [http://www.worldclimatereport.com/index.php/2008/06/20/finnish-finish-global-warming/#more-329]
The following figure shows reconstructed summer temperature data for the last 1,300 years (gray) with smoothed data at the decadal, multi-decadal, centennial, and multi-centennial time frames. The authors wrote “The warmest and coldest reconstructed 250-year periods occurred AD 931-1180 and AD 1601-1850. These periods overlap with the Medieval Warm Period (MWP) and the Little Ice Age (LIA). The coldest and warmest of all reconstructed 100-year periods occurred AD 1587-1686 and AD 1895-1994, respectively.”