Global Warming Science - www.appinsys.com/GlobalWarming
Alabama
[last update: 2010/03/31]
|
In 1997 The University of Alabama published “Policy Planning to Reduce Greenhouse Gas Emissions in Alabama”, available on the EPA website: [http://www.epa.gov/climatechange/wycd/stateandlocalgov/downloads/Alabama_action_plan.pdf]
The report stated: “Where appropriate, the Advisory Panel indicated a preference for voluntary rather than mandated programs. This should not be surprising, since the debate about the reality of global warming continues at the local, state, national, and world arena. Without clearer proof of global warming, policy makers from conservative states such as Alabama will not be anxious to implement local and state mandates to reduce emissions. … The economic effect of such policies will result in changes in aggregate prices, income distribution, employment, and output and trade of a region, and could result in more economic harm than the harm from global warming itself.”
Indeed, evidence of global warming is non-existent in the southeastern United States.
|
|
Temperature
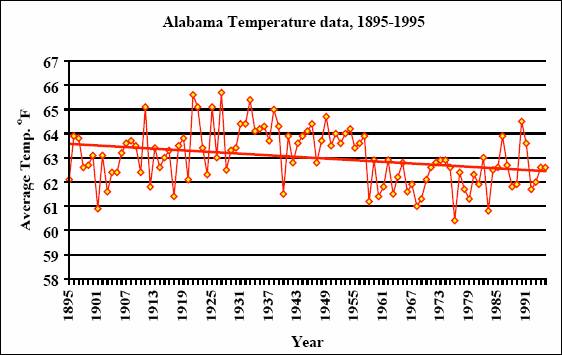
The following figure is from the UA report, which stated: “Although global data indicate that a warming trend of approximately one degree F is now evident, temperature data for Alabama over the past 100 years show a slight cooling trend (about one degree F for the 100 years)”
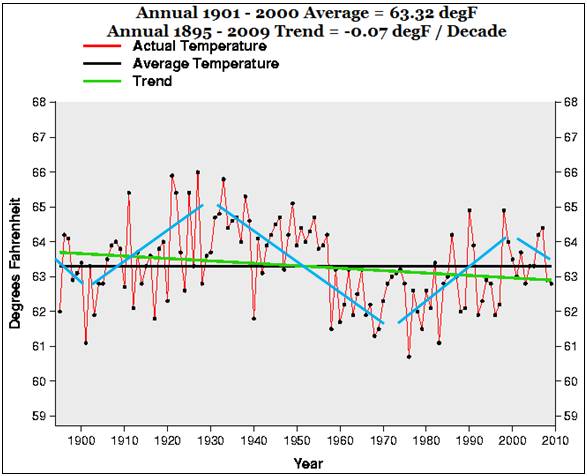
The following figure shows the average annual temperature for Alabama through 2009 from the NCDC database [http://www.ncdc.noaa.gov/oa/climate/research/cag3/al.html] Rather than a continuous slight cooling trend, the temperature exhibits a cyclic nature with a period of approximately 68 years, and a slight cooling between cycle peaks.
The following figure compares the average annual temperature from the 1997 report with the 2009 data.
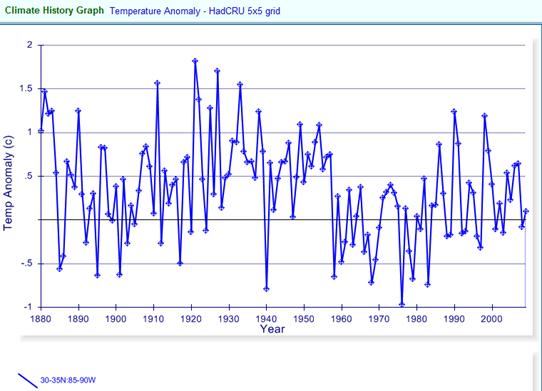
The following figure shows the average annual temperature anomaly for the 5x5 degree grid covering Alabama from the HadCRU (CRUTEM3) database (plotted at http://www.appinsys.com/GlobalWarming/climate.aspx)
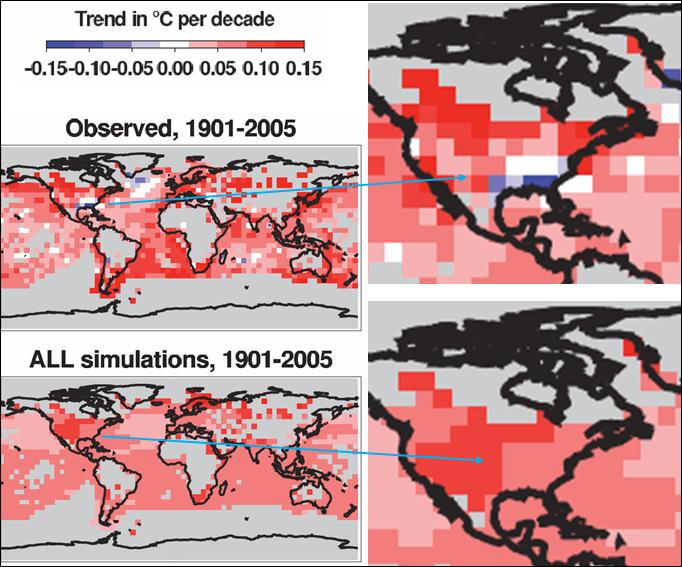
The following figure is from the IPCC AR4 report (2007) Figure 9.6 showing the trend in observed temperature from 1901 to 2005 using HadCRU gridded data (top) and trend from 58 model simulations from 14 climate models including both anthropogenic and natural forcings. [http://www.ipcc.ch/pdf/assessment-report/ar4/wg1/ar4-wg1-chapter9.pdf]
The models have a problem with the southeast United States – the models show 0.05 – 0.10 degrees per decade of warming, whereas the observations show cooling.
|
|
Precipitation
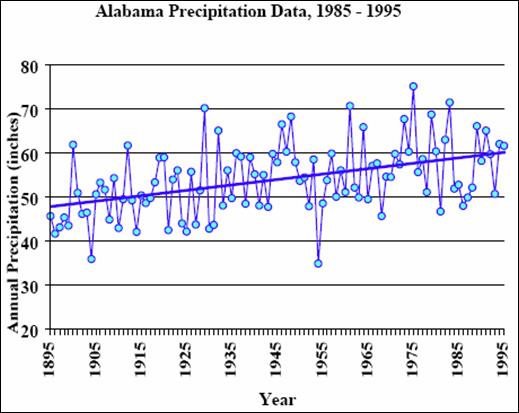
The following figure is from the UA report, which stated: “Precipitation data for the state shows an increase of about 12 inches for the 100 years, leading to some speculation about the interaction of these two parameters in affecting Alabama’s climate.”
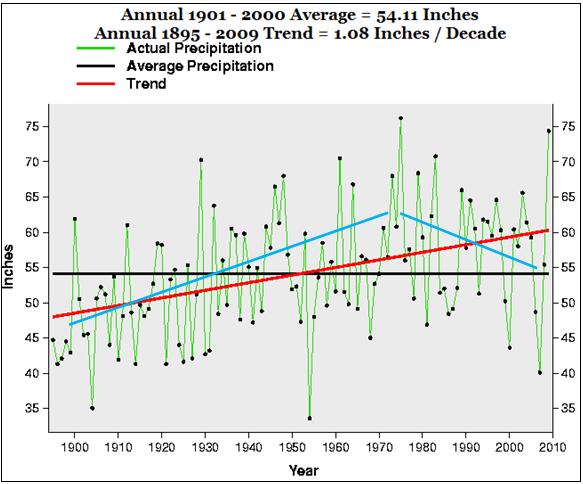
The following figure shows the total annual precipitation for Alabama through 2009 from the NCDC database [http://www.ncdc.noaa.gov/oa/climate/research/cag3/al.html] Rather than a continuous slight increasing trend, the precipitation perhaps exhibits a cyclic nature with insufficient history to determine the cycle.
The following figure compares the total annual precipitation from the 1997 report with the 2009 data.
|
|
Atlantic Multidecadal Oscillation (AMO)
The following figure shows the Atlantic Multidecadal Oscillation from 1850 to 2008 [http://en.wikipedia.org/wiki/File:Amo_timeseries_1856-present.svg].
The following figure superimposes the Alabama annual average temperature from NCDC shown previously, changed to green. The Alabama temperature shows a strong correlation although it seems to lead the AMO.
For more info on the AMO see: http://www.appinsys.com/GlobalWarming/AMO.htm
|
|
|