Global Warming Science: www.appinsys.com/GlobalWarming
Northern Europe
[last update: 2010/02/16]
|
IPCC / HadCRU Data
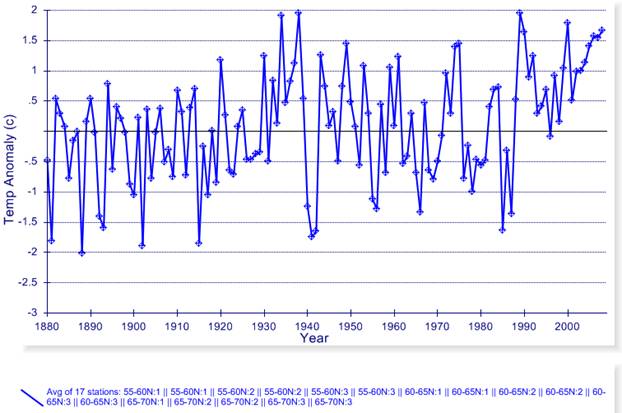
The following figure shows the average of all HadCRU (CRUTEM3) 5x5 degree gridded data for the area bounded by 55-70N x 5-35E covering the Scandinavia area of northern Europe for 1880 through 2008. (plotted at http://www.appinsys.com/GlobalWarming/climate.aspx) The warmest years were 1938 and 1989.
The following figure compares the above data with the IPCC AR4 graph for Northern Europe (from Fig. 9.12 http://www.ipcc.ch/pdf/assessment-report/ar4/wg1/ar4-wg1-chapter9.pdf) (The blue band is from models using natural forcings; the red band from models including CO2.) The data starts to trend above the natural forcing models after the 1988-89 jump in temperatures.
Since the IPCC does not define the exact area of Northern Europe in the above (NEU) figure, the following figure compares two possible definitions: The blue line shows the expanded area of 50-70N x -10-40E and the red line shows the 55-70N x 5-35E area shown above.
|
|
Recurrent Cycles
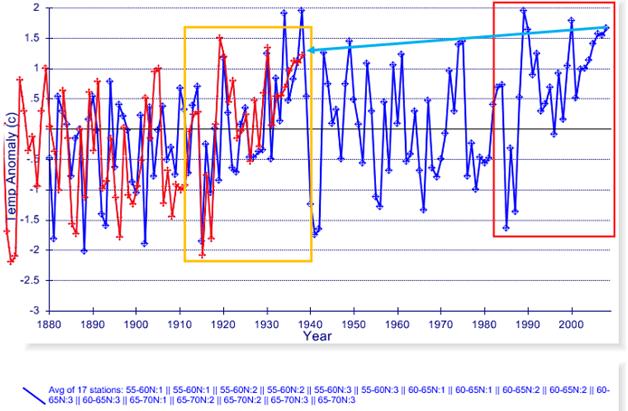
The following figure examines the approximately 70 year cycle apparent in the data. The temperature plot (blue) was shifted back seventy years and down 0.4 degrees (red). The red box area is moved back in time to the orange box. The cycles are almost identical with an increase of 0.4 degrees over seventy years. If the pattern continues there will soon be a sharp decline in temperatures.
|
|
Norway
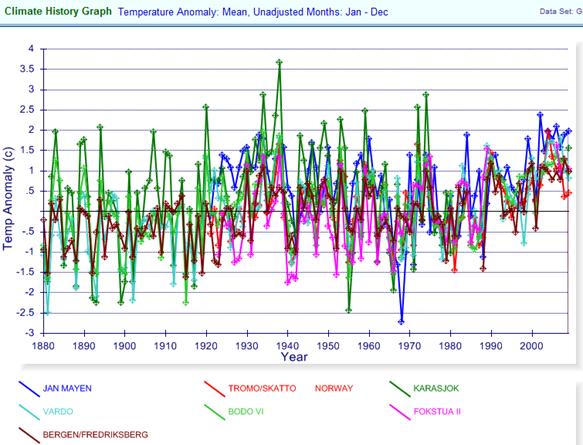
There are 7 stations in the GHCN database in Norway with data prior to 1930 and after 2000. The following figure shows the average annual temperature anomalies for these stations.
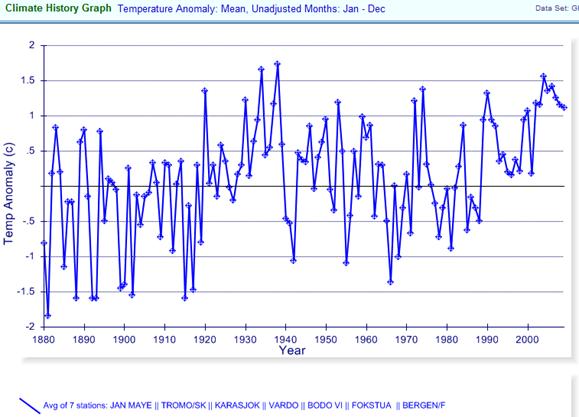
The following figure shows the average of the above 7 stations.
|
|
Sweden
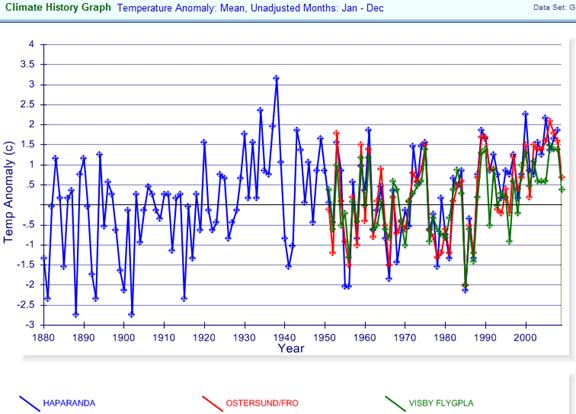
There is only one station in the GHCN database in Sweden with data prior to 1930 and after 2000. There are a couple of stations with data starting in 1949. The following figure shows the average annual temperature anomalies for these stations.
|
|
Finland
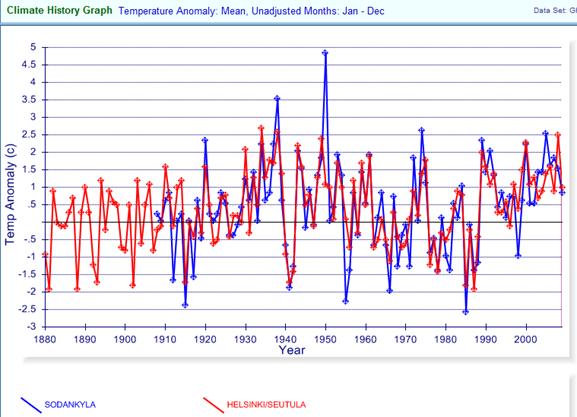
There are 2 stations in the GHCN database in Sweden with data prior to 1930 and after 2000. The following figure shows the average annual temperature anomalies for these stations.
|
|
|