Global Warming Science - www.appinsys.com/GlobalWarming
Earth’s Magnetic Field Change and Global Temperature
[last update: 2009/08/02]
|
The following sequence of images shows the annual change in magnetic field total intensity for each 5 years from 1900 to 2005 (the complete set of data available at NOAA [ftp://ftp.ngdc.noaa.gov/Solid_Earth/Mainfld_Mag/images]). On these images, the blue contours are intervals of decreasing field strength, the red lines are increasing field strength and the green line is the zero change contour. The overall trend that is noticeable is increasing magnetic field area from the early 1900s to a peak in the 1940-1945 timeframe, followed by decreasing magnetic field until the 1975-1980 timeframe, and then increasing until 2005.
|
|
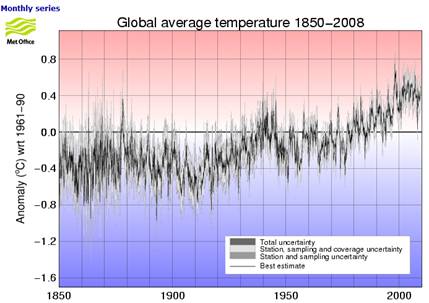
The following figure shows the global average temperature from 1850 – 2008 [http://hadobs.metoffice.com/hadcrut3/diagnostics/global/nh+sh/].
|
|
The following figure shows the correspondence of the minima and maxima in magnetic field change with the corresponding timeframes on the global temperature trend from above. There is a distinct correspondence between the trend in magnetic field strength and the trend in global temperature. The magnetic field increases until the mid-1940s temperature peak and then decreases until the 1975-1980 timeframe when it starts increasing in conjunction with the increasing temperature.
|
|
|