Global Warming Science - www.appinsys.com/GlobalWarming
IPCC – Fail: Predictions Made in 1995
[last update: 2011/06/25]
|
IPCC – Alarmist Predictions Echoed In New York Times
In September 1995, the New York Times reported that IPCC scientists were predicting widespread climate disruption. (The IPCC was preparing the Second Assessment Report (SAR) released in 1996.) [http://select.nytimes.com/gst/abstract.html?res=F60613FB3C5D0C7B8DDDA00894DD494D81]
The picture of probable disruption, including adverse changes and some that are beneficial, emerges from draft sections of a new assessment of the climate problem by the Intergovernmental Panel on Climate Change.
So, after 15 years, how are the IPCC predictions doing?
|
|
Temperature
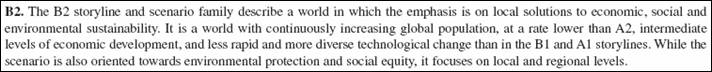
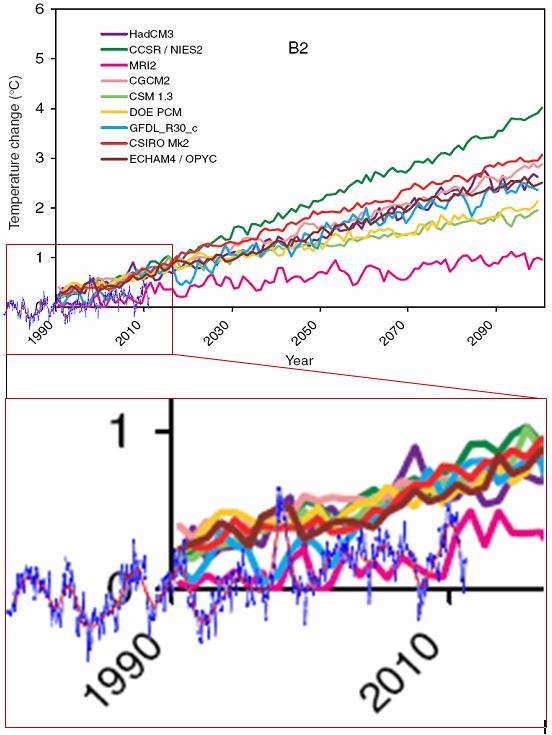
The IPCC SAR temperature projections can be found here: [https://www.ipcc.ch/ipccreports/tar/wg1/pdf/TAR-09.PDF] The B2 “storyline” produces the lowest temperature projections than the of the various scenarios used in the SAR. From the report:
The following figure shows the temperature projections for storyline B2 from various climate models, from the SAR.
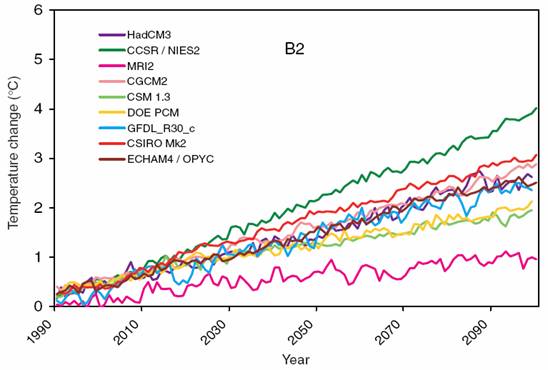
The following figure shows the most recent global average satellite based temperatures [http://www.drroyspencer.com/2011/06/uah-temperature-update-for-may-2011-0-13-deg-c/]
The following figure combines the above two figures.
The MRI2 model is the only one that is close to the actual temperature. And the B2 scenario has an “emphasis is on local solutions to economic, social and environmental sustainability.” So we have already achieved sustainability, even though the IPCC continues to promote alarmist scenarios. Temperatures are well below what most climate models have predicted. Fail.
|
|
Sea Level
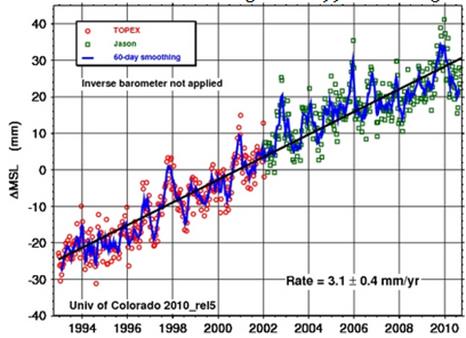
“A continuing rise in average global sea level, which is likely to amount to more than a foot and a half by the year 2100. … most of the beaches on the East Coast of the United States would be gone in 25 years [2020]. … Since its last full assessment in 1990, the panel has cut its estimate of expected average sea-level rise between now and 2100 from a "best estimate" of 26 inches to a little less than 20 inches, with a possible range of 10 to 31 inches.”
The following figure shows the sea level rise since the IPCC report from satellite measurements [http://sealevel.colorado.edu/].
At this rate, the rise would be less than 13 inches from 1995 to 2100, not 18 inches. We are also 15 years into the 25 years until most of the US East Coast beaches will be gone. Fail.
|
|
Winter Snow
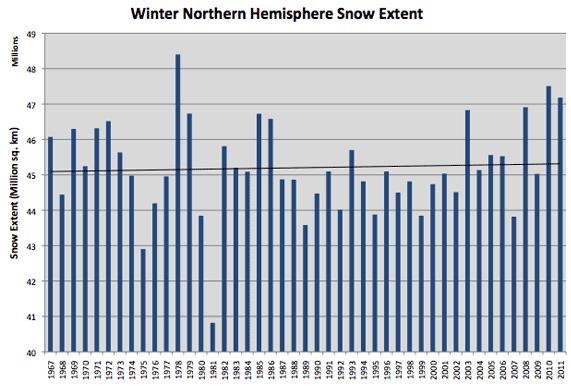
“A "striking" retreat of mountain glaciers around the world, accompanied in the Northern Hemisphere by a shrinking snow cover in winter. … Northern temperate regions would experience more rain and less snow in winter.”
While mountain glaciers have been retreating since the 1800s, the rate has not increased (see: [http://www.appinsys.com/GlobalWarming/GW_4CE_Glaciers.htm])
The following figure shows winter Northern Hemisphere snow cover [http://climate.rutgers.edu/snowcover/chart_seasonal.php?ui_set=nhland&ui_season=1]
Less snow? Fail.
|
|
Africa
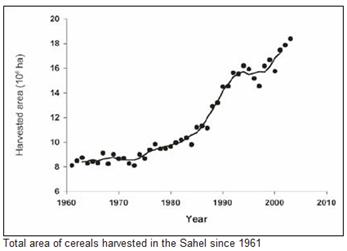
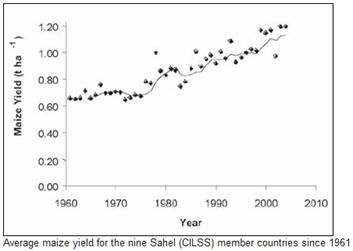
“some regions -- especially sub-Saharan Africa, South and Southeast Asia and tropical Latin America -- could suffer losses in their harvests. Deserts are expected to expand, and the heartlands of continents to become drier.”
[The IPCC 4AR, 2007, says “By 2080, an increase of 5 to 8% of arid and semi-arid land in Africa is projected under a range of climate scenarios (high confidence).”]
The following figures show increases in both cultivated cereal area and maize yields – see: http://www.appinsys.com/GlobalWarming/IPCC_AfricaCrops.htm
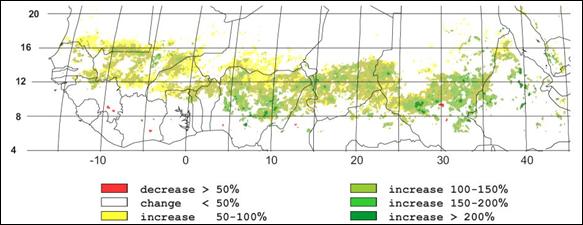
The following figure shows the Normalized Difference Vegetation Index (NDVI), showing substantial increases throughout most of the region. [http://www.eoearth.org/article/Greening_of_the_Sahel].– see: [http://www.appinsys.com/GlobalWarming/RS_Sahel.htm]
NDVI (Normalized Difference Vegetation Index) 1982 - 1999
The following figure shows observed NDVI trend for the Sahel from another study. [http://www.biogeosciences-discuss.net/5/3045/2008/bgd-5-3045-2008.pdf]
Even the normally alarmist National Geographic admits it: “Sahara Desert Greening Due to Climate Change?”, July 2009 [http://news.nationalgeographic.com/news/2009/07/090731-green-sahara.html]: “Desertification, drought, and despair—that's what global warming has in store for much of Africa. Or so we hear. Emerging evidence is painting a very different scenario, one in which rising temperatures could benefit millions of Africans in the driest parts of the continent. Scientists are now seeing signals that the Sahara desert and surrounding regions are greening due to increasing rainfall. … Images taken between 1982 and 2002 revealed extensive regreening throughout the Sahel, according to a new study in the journal Biogeosciences. … "Now you have people grazing their camels in areas which may not have been used for hundreds or even thousands of years. You see birds, ostriches, gazelles coming back, even sorts of amphibians coming back," he said. "The trend has continued for more than 20 years. It is indisputable."”
Increased deserts? Fail.
|
|
Non-Fail
Did they get anything right? Only the parts not reported by the mainstream media:
“Beneficial effects, if the panel's forecast is right, would include, for instance, milder winters in northern climes, an increase in rainfall in some regions that need it, and faster crop growth. Grain belts of North America and Russia could expand. Agricultural production worldwide is not expected to decrease much.”
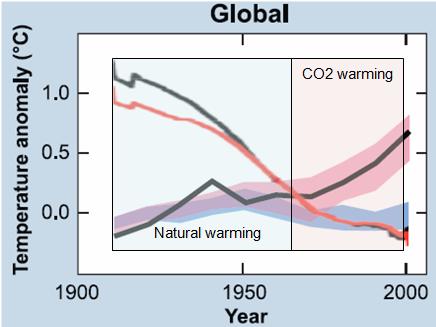
“The human contribution to global warming could range from highly significant to trivial. The scientists say it is not yet possible to measure how much of the warming has been caused by human activity and how much is a result of natural causes.”
|
|
|