Global Warming
[This is part 2 of the Global Warming Summary series at www.appinsys.com/GlobalWarming]
Part
2: The IPCC Hockey Stick and the Medieval Warm Period
The “hockey stick”
graph produced by Michael Mann was influential in creating the current global
warming crisis. The hockey stick graph (so-called because of its shape) appears to show that the Earth’s
climate was very stable from AD1000 to 1900, and then suddenly began to change,
with temperatures in the Northern Hemisphere rising dramatically. It was
central to the 2001 Third Assessment Report (TAR) from the Intergovernmental
Panel on Climate Change (IPCC). It appears several times within the reports
that are part of the TAR. This was a major impetus in creating the current notion that a
crisis is looming and that it is caused by CO2 released by the burning of
fossil fuels.
Figure 2-1 shows pages 28-29 of the IPCC 2001 TAR technical Summary. The right-hand page shows the hockey-stick graph, while the left-hand page shows two other relevant climate data series.
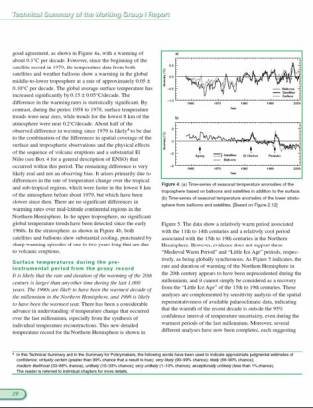
Figure 2-1: Extract of IPCC Technical
Summary pages 28-29
The shown in Figure 2-1 left-hand page, show the global average of tropospheric temperatures derived using weather satellites (upper graph) and the lower stratospheric temperatures from balloons and satellites. This is enlarged below in Figure 2-2. As can be seen by comparing the atmospheric data to the hockey stick, graph a different trend is observed. However, the graph of satellite-measured tropospheric data was omitted altogether from the IPCC TAR Summary for Policymakers. As soon as the IPCC Report came out, the hockey stick version of climate history became canonical – it became the “consensus” view (Part 7 of the Global Warming Summary discusses how consensual the consensus is.)
Figure 2-2: Larger View of Satellite
and Balloon Data From IPCC Technical Summary page 28
Scientists try to estimate local climate histories over past
centuries using various techniques, including temperature proxies of various
types. (Part 1 of the Global Warming Summary discusses the various long-term
temperature trend graphs). Proxies include a wide range of measures that are,
potentially, sensitive to local temperature trends, such as tree ring widths,
ice cores, and ground boreholes. Boreholes drilled into the ground have a
vertical temperature profile that can be inverted to yield an estimate of the
historical temperature sequence at the surface. Michael Mann’s data is composed
of various proxy data sets, mainly based on tree rings. In 1998 Nature published the first Mann hockey stick
paper, commonly called “MBH98.” Mann et al. followed up in 1999 with
a paper in Geophysical Research Letters (“MBH99”) extending their results from
AD1400 back to AD1000. In early 2000 the IPCC released the first
draft of the TAR. The hockey stick was the only paleoclimate reconstruction
shown in the Summary, even though most other scientists disagree with the
elimination of the Medieval Warm Period and Little Ice Age.
Ross McKitrick of the University of Guelph did an in-depth study of Michael Mann’s data used to produce the hockey stick graph. What he found was that Mann used a data analysis method that essentially forced the data sets (mostly tree-ring proxies, but also other proxies) to take the shape of strongest shapes found in any data set. Most of the data sets exhibited no trend. But those that did were weighted in an unrealistic manner. Detailed information about his analysis can be found at http://www.uoguelph.ca/~rmckitri/research/trc.html.
Figure 2-3 shows two of Mann’s tree-ring proxy data sets. Both series are the same length,
but due to the increasing trend in the 20th century in the top
panel, Mann’s algorithm gives that series 390 times the weight of the bottom
series.
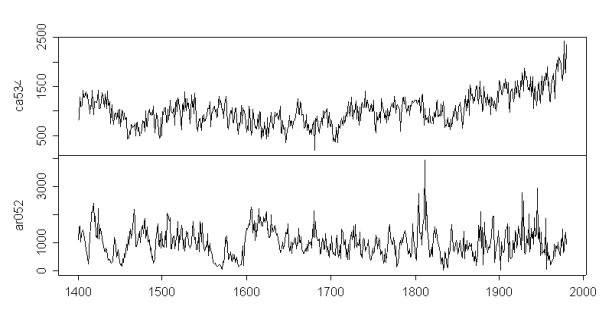
Figure 2-3:
Two tree ring chronologies from the MBH98 data set. Top: Sheep Mountain,
CA, USA. Bottom: Mayberry Slough
McKitrick found many errors in Mann’s data analysis methods,
which have been published [McIntyre, Stephen and Ross McKitrick (2005a) “The
M&M Critique of the MBH98 Northern Hemisphere Climate Index: Update and
Implications.” Energy and Environment 16(1) pp. 69-100; (2005b) “Hockey Sticks,
Principal Components and Spurious Significance” Geophysical Research Letters
Vol. 32, No. 3, L03710 10.1029/2004GL021750 12 February 2005. See www.climateaudit.org.]
Figure 2-4 shows one of the results of McKitrick’s analyses where invalid data were removed. The hockey stick (dashed line) ends up showing the occurrence of the Medieval Warm Period (something that Mann denies occurred).
In 2006 a National
Academy of Sciences (NAS) panel investigated the hockey stick graph used by the
(IPCC) to promote the idea that humans are causing rapid and unprecedented
global warming. McKitrick had argued that the hockey stick relied for its shape
on the inclusion of a small set of invalid proxy data (called bristlecone, or
“strip-bark” records). If they are removed, the conclusion that the 20th century is
unusually warm compared to the pre-1450 interval is reversed. Hence the
conclusion of unique late 20th century warmth does not hold up under minor
variations in data or methods. The NAS panel agreed, saying Mann’s results are
“strongly dependent” on the strip-bark data (pp. 106-107), and they went
further, warning that strip-bark data should not be used in this type of
research (p. 50).
McKitrick’s analysis was further backed up
by a study by Wegman etc al [Edward J. Wegman, George Mason University, David W. Scott,
Rice University, and Yasmin H. Said, The Johns Hopkins University.], which verified that Mann’s hockey-stick
graph was invalid.
Figure 2-4: Dashed line:
MBH98 proxy-based Northern Hemisphere temperature index reconstruction. Solid
line: Series resulting from using corrected PCs (retaining 5 PCs in the North
America network), removing Gaspé extrapolation and applying CO2 fertilization
adjustment to full length of bristlecone pine series
The Medieval Warm Period (MWP) was previously accepted as a warm period that occurred in the time frame of about 1000-1400 AD. That is, until the advent of IPCC and Mann’s hockey stick – now many claim the MWP never happened, or that it was a minimal regional event. But many others do not accept the recent IPCC-inspired rejection of the MWP, which was based on Mann’s flawed study.
Figure 2-5: Red Line – 1980’s
Accepted Temperature Trend, Blue Line – IPCC 2001 Hockey Stick, Black Line –
Moberg et. al (see Fig 1-3 and 1-4)
The IPCC 1990
report showed the temperature graph of the red line in Figure 2-5, which
indicates the MWP and the Little Ice Age (LIA). But in the IPCC 1995 report the
only pre-instrumental temperature trend uses a northern hemisphere temperature
reconstruction, starting in 1400 -thus leaving out the MWP. The IPCC 2001
report (TAR) shows temperature reconstructions starting from 1000 AD from Mann,
Jones and Briffa and prominently displays the hockey-stick graph as shown in
Figure 2-1. The TAR states: “the posited Medieval Warm Period appears to have been
less distinct, more moderate in amplitude… The Northern Hemisphere mean
temperature estimates of Jones et al. (1998), Mann et al. (1999), and Crowley
and Lowery (2000) show temperatures from the 11th to 14th centuries to be about
0.2°C warmer than those from the 15th to 19th centuries, but rather below
mid-20th century temperatures. Thus current evidence does not support globally
synchronous periods of anomalous cold or warmth over this timeframe, and the
conventional terms of "Little Ice Age" and "Medieval Warm Period"
appear to have limited utility in describing trends in hemispheric or global
mean temperature changes in past centuries ”
This is at odds
with the findings of other scientists. For example, research at the
Harvard-Smithsonian Center for Astrophysics report on a recent paper using
proxies, which verifies the occurrence of the MWP: [http://cfa-www.harvard.edu/press/pr0310.html] “A
review of more than 200 climate studies led by researchers at the
Harvard-Smithsonian Center for Astrophysics has determined that the 20th
century is neither the warmest century nor the century with the most extreme
weather of the past 1000 years. The review also confirmed that the Medieval
Warm Period of 800 to 1300 A.D. and the Little Ice Age of 1300 to 1900 A.D.
were worldwide phenomena not limited to the European and North American
continents. While 20th century temperatures are much higher than in the Little
Ice Age period, many parts of the world show the medieval warmth to be greater
than that of the 20th century.”
The University of Southern California course material on climate change in the last millennium [http://earth.usc.edu/geol150/evolution/lastmillenia.html] also provides supporting evidence of the MWP and LIA (although after citing evidence from all continents they say it may be just regional existing only in the northern hemisphere).
Many studies can be found exhibiting the MWP. One example is shown in Figure 2-6.
[http://www.wsl.ch/staff/jan.esper/publications/QRS_Cook_2004.pdf] One of the authors of the study said "The Medieval Warm Period is in some sense comparable up to 1990 in the 20th century," said Cook. "But that does not say that the 20th century hasn't been perturbed by greenhouse gases. The real challenge is to factor out the natural variability from" manmade causes of global warming.”
[http://www.usatoday.com/news/science/climate/2002-02-03-tree-rings.htm]
Figure 2-6: Temperature Trend
Exhibiting MWP Around Year 1000
One of the most recent
multi-proxy reconstructions was published in 2005 by Moberg et al (Highly
variable Northern Hemisphere temperatures reconstructed from low- and
high-resolution proxy data
Nature, Vol. 433, No. 7026, pp. 613 - 617, 10
February 2005 -- Anders Moberg, Dmitry M. Sonechkin, Karin Holmgren, Nina M.
Datsenko & Wibjörn Karlén) (This is the red line shown in Figure 1-4 in
Part 1. of this document) [http://www.ncdc.noaa.gov/paleo/pubs/moberg2005/moberg2005.html] and [http://stephenschneider.stanford.edu/Publications/PDF_Papers/MobergEtAl2005.pdf] Their paper states “These reconstructions have mainly used
tree-ring data and other data sets of annual to decadal resolution. Lake and
ocean sediments have a lower time resolution, but provide climate information
at multicentennial timescales that may not be captured by tree-ring data. Here
we reconstruct Northern Hemisphere temperatures for the past 2,000 years by
combining low-resolution proxies with tree-ring data, using a wavelet transform
technique to achieve timescale-dependent processing of the data. Our
reconstruction shows larger multicentennial variability than most previous
multi-proxy reconstructions, but agrees well with temperatures reconstructed
from borehole measurements and with temperatures obtained with a general
circulation model. According to our reconstruction, high temperatures - similar
to those observed in the twentieth century before 1990- occurred around AD 1000
to 1100, and minimum temperatures that are about 0.7K below the average of
1961-90 occurred around AD 1600. This large natural variability in the past
suggests an important role of natural multicentennial variability that is
likely to continue… The main implication of our study, however, is that natural
multicentennial climate variability may be larger than commonly thought, and
that much of this variability could result from a response to natural changes
in radiative forcings.”
Figure 2-7 is from their paper. The MJ line in 2-7
a) is the Mann – Jones multi-proxy study while the MBH line in 2-7 d) is the
Mann et al proxy study (the hockey stick), further evidence of how Mann’s
hockey stick does not match reality. One of the proxies included in Moberg et al is the July
temperatures at Lake Tsuolbmajavri (Finland) shown in Figure 2-8 based on
diatoms in lake sediments.
Although the IPCC denies the existence of the MWP
and LIA as global events, many studies exist from around the world verifying
the events. (The fact that the current warming varies significantly around the
world seems irrelevant to them – they want to deny it to justify their hockey
stick). A couple of examples:
“The Little Ice Age and Medieval Warm Period in the
Sargasso Sea” (Science 29 November 1996:
Vol. 274. no. 5292, pp. 1503 – 1508) by Lloyd D. Keigwin (Woods Hole
Oceanographic Institution)
[http://www.sciencemag.org/cgi/content/abstract/274/5292/1503?rbfvrToken=b3527f8140d1ddfd7f0fdac765ac49b01f52eacb] which states: “Results from a
radiocarbon-dated box core show that SST was ![]() 1°C
cooler than today
1°C
cooler than today ![]() 400
years ago (the Little Ice Age) and 1700 years ago, and
400
years ago (the Little Ice Age) and 1700 years ago, and ![]() 1°C
warmer than today 1000 years ago (the Medieval Warm Period). Thus,
at least some of the warming since the Little Ice Age appears to be
part of a natural oscillation.”
1°C
warmer than today 1000 years ago (the Medieval Warm Period). Thus,
at least some of the warming since the Little Ice Age appears to be
part of a natural oscillation.”
“Was the Medieval Warm Period Global?” (Science
23 February 2001: Vol. 291. no. 5508, pp. 1497 - 1499) by Wallace S. Broecker (Lamont-Doherty
Earth Observatory, Columbia University) [http://www.sciencemag.org/cgi/content/summary/291/5508/1497] summary states: “During the Medieval Warm
Period (800 to 1200 A.D.), the Vikings colonized Greenland. In his Perspective,
Broeker discusses whether this warm period was global or regional in extent. He
argues that it is the last in a long series of climate fluctuations in the
North Atlantic, that it was likely global, and that the present warming should
be attributed in part to such an oscillation, upon which the warming due to
greenhouse gases is superimposed.”
Figure 2-7: Moberg 2005 Multi-Proxy Temperature Reconstruction (2000 Years)
Figure 2-8: July temperatures at Lake Tsuolbmajavri
(years before present)
“Little Ice Age and Medieval Warm
Periods in Eastern China as Read from the Speleothem Records” (American
Geophysical Union, 2002) by H. Li and T. Ku (University of Southern California,
Department of Earth Sciences) [http://adsabs.harvard.edu/abs/2002AGUFMPP71C..09L]
which states “The
long-term climatic pace has often been interrupted by short-term abrupt
changes. The Little Ice Age and Medieval
Warm Period represent the two most important such
changes over the last two millennia. Largely due to a dearth of high-resolution
climatic records, our knowledge on the spatial extent, duration, and moisture
characteristics of these two events is incomplete, and this has hampered our
understanding of the driving force causing them as well as the recent global
warming trend. … The records show that in eastern China, the Medieval Warm Period
started around 1000 AD and lasted until 1500 AD. A brief cooling during this warm interval occurred around 1150 AD. The Little Ice Age in China started at around 1500 AD and ended in the mid-1800s.”
“Tree-ring and glacial evidence for the medieval warm
epoch and the little ice age in southern South America” (Climate Change Journal
Volume 26, Numbers 2-3 / March, 1994) by Ricardo Villalba
(Laboratorio
de Dendrocronologia, Argentina) [http://www.springerlink.com/content/x0214563n1n44731/ ] which states: “A
tree-ring reconstruction of summer temperatures from northern Patagonia shows
distinct episodes of higher and lower temperature during the last 1000 yr. The
first cold interval was from A.D. 900 to 1070, which was followed by a warm
period A.D. 1080 to 1250 (approximately coincident with the Medieval Warm
Epoch).”
Although
the IPCC no longer uses the hockey stick grpah, they have replaced it with a
graph of multiple proxy studies, as shown in Figure 2-9. Recently IPCC AR4 reviewer
Steve McIntyre described his review of the usage of bristlecone and foxtail
pines in the IPCC temperature proxy figure (shown below) [http://www.climateaudit.org/?p=2245].
Figure 2-9: Box 6.4 Figure 1 from the IPCC 4AR
(Chapter 6)
In
his review, McIntyre critcized the IPCC for including proxies that were based
on bristlecone and foxtail pines (since tree rings from these trees have been
shown in various studies to exhibit no correlation with temperature). McIntyre
calculated correlations for the included studies and found that some had zero
correlation to temperatures at the study locations. The IPCC lead author of the
section rejected the reviewer’s comment stating: “the purpose of this Figure is to
illustrate in a simple fashion, the variability of numerous records that have
been used in published reconstructions of large-scale temperature changes”. The figure shown above also
includes the discredited MBH1999 hockey stick.
Dr. David Deming (University of Oklahoma, College of Earth and Energy) said in his testimony to congress [http://epw.senate.gov/hearing_statements.cfm?id=266543] “I had another interesting experience around the time my paper in Science was published. I received an astonishing email from a major researcher in the area of climate change. He said, "We have to get rid of the Medieval Warm Period.” The existence of the MWP had been recognized in the scientific literature for decades. But now it was a major embarrassment to those maintaining that the 20th century warming was truly anomalous.”