Global Warming Science - www.appinsys.com/GlobalWarming
Clouds
[last update: 2010/12/09]
|
Clouds remain one of the areas of greatest uncertainty in climate modeling. Clouds trap heat radiating from the Earth, causing warming. Clouds reflect sunlight preventing it from reaching the Earth, causing cooling. Clouds also transport heat from the Earth’s surface to the top of the troposphere, causing surface cooling.
|
|
IPCC Climate Models and Clouds
The IPCC AR4 report (2007) WG1 Chapter 8 reviews climate models (historical overview in Chapter 1)
From Chapter 1 ([http://www.ipcc.ch/pdf/assessment-report/ar4/wg1/ar4-wg1-chapter1.pdf]):
From Chapter 8 [http://www.ipcc.ch/pdf/assessment-report/ar4/wg1/ar4-wg1-chapter8.pdf] (not much has changed since the history of Chapter 1):
Clouds cause additional warming (positive feedback) …clouds cause cooling (negative feedback)… but they have no idea which dominates. The above quotes are from the IPCC AR4 2007 report that Obama uses to justify massive changes to the US economy via cap-and-trade of CO2 permits.
The importance of clouds in global temperature: clouds cover about 65% of the globe (annual average) and provide net cooling of 30 W/m2 (compared to the anthropogenic greenhouse gas net warming of 1.6 W.m2) [http://cdsweb.cern.ch/record/1181073/]
Climate models have problems with clouds. “Comparison of observed and anthropogenic-forced model changes in DTR [diurnal temperature range] over the last 50 years show much less reduction in DTR in the model simulations due to greater warming of maximum temperatures in the models than observed. This difference is likely attributed to increases in cloud cover that are observed over the same period and are absent in model simulations.” [http://www.agu.org/journals/ABS/2004/2004GL019998.shtml]
A paper examining climate model feedbacks (Zhang, Institute for Terrestrial and Planetary Atmosphere, “Cloud-Climate Feedback: How Much Do We Know?”, 2003): “it can be concluded that we are still far away from confidently simulating model clouds and their climate feedbacks.” [ftp://128.95.176.42/pub/breth/CPT/zhang_cloud-feedback-04.pdf]
The Royal Society published a “summary of the science” in September 2010 [http://royalsociety.org/climate-change-summary-of-science/] which states: “projections of climate change are sensitive to the details of the representation of clouds in models. ... Current scientific understanding of this effect is poor.”
|
|
Clouds Provide Net Negative Feedback
Clouds result in warming or cooling locally depending on the amount of solar radiation available (i.e. night / day and summer / winter) and type of cloud. When the solar radiation is lacking or reduced (night / winter), clouds result in warmer temperatures; when the solar radiation is high (day / summer), clouds result in cooler temperatures. Globally the effect is based on when and where the clouds are. “In the longwave, clouds generally reduce the radiation emission to space and thus result in a heating of the planet. While in the solar (or shortwave), clouds reduce the absorbed solar radiation, due to a generally higher albedo than the underlying surface, and thus result in a cooling of the planet.” [http://cimss.ssec.wisc.edu/wxwise/homerbe.html] Many studies have shown that clouds at a global scale provide negative feedback.
Richard Lindzen (MIT Atmospheric Science Professor) states: “there is a much more fundamental and unambiguous check of the role of feedbacks in enhancing greenhouse warming that also shows that all models are greatly exaggerating climate sensitivity. Here, it must be noted that the greenhouse effect operates by inhibiting the cooling of the climate by reducing net outgoing radiation. However, the contribution of increasing CO2 alone does not, in fact, lead to much warming (approximately 1 deg. C for each doubling of CO2). The larger predictions from climate models are due to the fact that, within these models, the more important greenhouse substances, water vapor and clouds, act to greatly amplify whatever CO2 does. This is referred to as a positive feedback. It means that increases in surface temperature are accompanied by reductions in the net outgoing radiation – thus enhancing the greenhouse warming. ... Satellite observations of the earth’s radiation budget allow us to determine whether such a reduction does, in fact, accompany increases in surface temperature in nature. As it turns out, the satellite data from the ERBE instrument (Barkstrom, 1984, Wong et al, 2006) shows that the feedback in nature is strongly negative -- strongly reducing the direct effect of CO2 (Lindzen and Choi, 2009) in profound contrast to the model behavior.” [http://www.quadrant.org.au/blogs/doomed-planet/2009/07/resisting-climate-hysteria]
David Mansbach and Joel Norris (Scripps Institute of Oceanography) reported in the Journal of Climate 2006 “Low-level cloud variability over the equatorial cold tongue in observations and models”: “Low-level clouds combine a small greenhouse effect with a generally high albedo and thus contribute significantly to the overall net cooling role of clouds in Earth's climate (Ramanathan et al. 1989). Currently, lack of both resolution and appropriate physical parameterizations prohibit reliable large-scale numerical prediction of cloud-climate feedbacks (e.g. Stephens 2005; Bony and Dufresne 2005). … Previous investigations have demonstrated that atmosphere and coupled ocean- atmosphere general circulation models produce unrealistic simulations of low-level cloudiness over the eastern tropical Pacific which contribute to large biases in the climate state … we note that the observed inverse relationships between SST and SST advection and between cloud and SST advection imply the existence of a negative cloud feedback on and about the near-equatorial SST front. … The incorrect representation of this feedback in coupled ocean-atmosphere models may be a contributing factor to the development of SST biases in the equatorial cold tongue.” [http://meteora.ucsd.edu/~dmansbac/mansbachnorris.pdf]
Roy Spencer and William Braswell (Earth System Science Center, University of Alabama) reported problems with model feedbacks in the Journal of Climate 2008 “Potential Biases in Feedback Diagnosis from Observational Data: A Simple Model Demonstration”: “For model runs producing monthly shortwave flux anomaly and temperature anomaly statistics similar to those measured by satellites, the diagnosed feedbacks have positive biases generally in the range of -0.3 to -0.8 W / m2 /K. These results suggest that current observational diagnoses of cloud feedback—and possibly other feedbacks—could be significantly biased in the positive direction.” [http://www.drroyspencer.com/Spencer-and-Braswell-08.pdf]
“This critical component in global warming theory – cloud feedback – is impossible to measure directly in the real climate system,” Spencer said. “We haven’t figured out a good way to separate cause and effect, so we can’t measure cloud feedback directly. And if we don’t know what the feedbacks are, we are just guessing at how much impact humans will have on climate change.” [http://www.drroyspencer.com/2009/12/cloud-feedback-presentation-for-fall-2009-agu-meeting/]
Spencer and Braswell further explore the feedback issues: “Previous attempts to diagnose radiative feedback in the climate system from the covariations between TOA radiative flux and temperature have yielded generally low correlations and a wide variety of feedback estimates. The evidence presented here (from satellite, a simple forcing‐feedback model, and from coupled climate models) suggests that the dominant source of that decorrelation is the presence of time‐varying radiative forcing generated internal to the climate system.” [http://www.drroyspencer.com/wp-content/uploads/Spencer-Braswell-JGR-2010.pdf]
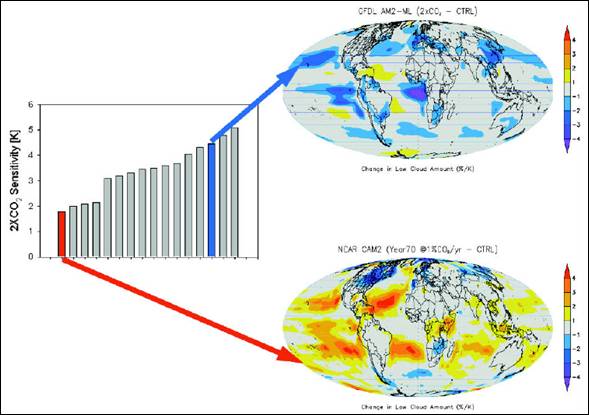
A 2005 paper (Graeme Stephens, “Cloud Feedbacks in the Climate System: A Critical Review”, Journal of Climate, Vol.18, 2005 [http://journals.ametsoc.org/doi/pdf/10.1175/JCLI-3243.1]) states: “different assumptions about the system produce very different conclusions about the magnitude and sign of feedbacks. Much more diligence is called for in terms of defining the system and justifying assumptions. In principle, there is also neither any theoretical basis to justify the system that defines feedbacks in terms of global–time-mean changes in surface temperature nor is there any compelling empirical evidence to do so. … Predictions of global warming by GCMs forced with prescribed increases of atmospheric CO2 are uncertain, and the range of uncertainty has, seemingly, not changed much from initial estimates given decades ago. The effects of potential changes in cloudiness as a key factor in the problem of climate change has been recognized since at least the 1970s. This point too is reiterated in Fig. 1 showing the range of surface warming estimates from a number of models that participated in the Coupled Model Intercomparison Project (CMIP)”
The following figure is Fig. 1 from that paper showing the cloud amounts on global regions. The climate models with high CO2 sensitivity result in reductions of clouds, while the models with low sensitivity have increased clouds. This implies either negative feedback (reducing sensitivity) or simply problems with the models, since they rely on increased water vapor to achieve a positive feedback and somehow that water vapor results in reduce cloud cover.
A 2010 paper by Graeme Stephens (Is There a Missing Low Cloud Feedback in Current Climate Models?) states: “The net consequence of these biases is that the optical depth of low clouds in GCMs is more than a factor of two greater than observed, resulting in albedos of clouds that are too high. … The implication of this optical depth bias that owes its source to biases in both the LWP and particle sizes is that the solar radiation reflected by low clouds is significantly enhanced in models compared to real clouds. This reflected sunlight bias has significant implications for the cloud-climate feedback problem. The consequence is that this bias artificially suppresses the low cloud optical depth feedback in models by almost a factor of four and thus its potential role as a negative feedback. This bias explains why the optical depth feedback is practically negligible in most global models” [http://www.gewex.org/images/G.Stephens_Feb2010GNews.pdf]
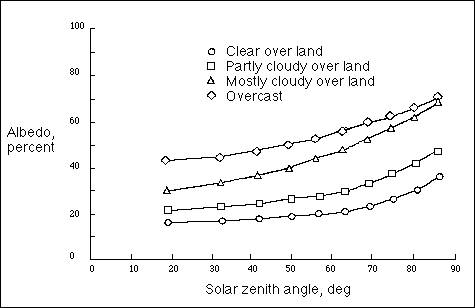
The following figure shows the albedo (sunlight reflectivity) from clouds over land from (ERBE data) [http://eosweb.larc.nasa.gov/guide/erbe/albedo_land.html] Increased albedo implies reduced heating from the sun.
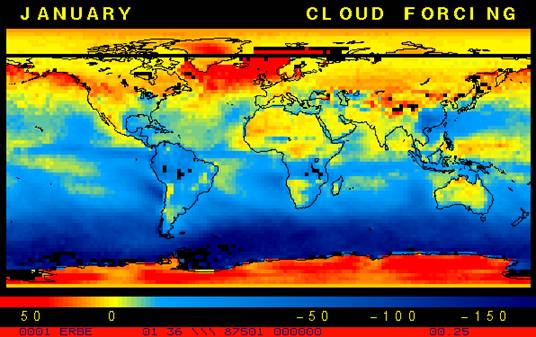
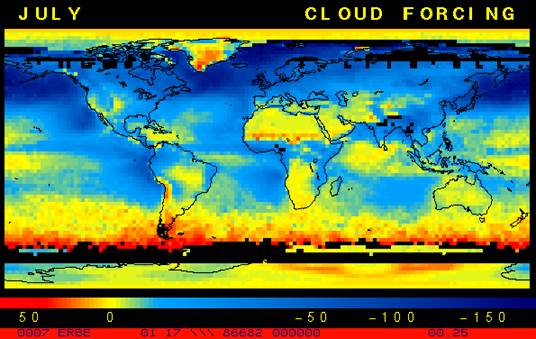
The following figures show the cloud forcing as determined from the ERBE satellite data. “The latest results from ERBE indicate that in the global mean, clouds reduce the radiative heating of the planet. This cooling is a function of season and ranges from approximately -13 to -21 Wm-2. While these values may seem small, they should be compared with the 4 Wm-2 heating predicted by a doubling of carbon dioxide concentration.” [http://cimss.ssec.wisc.edu/wxwise/homerbe.html]
(The NASA ERBE is described here: [http://asd-www.larc.nasa.gov/erbe/ASDerbe.html])
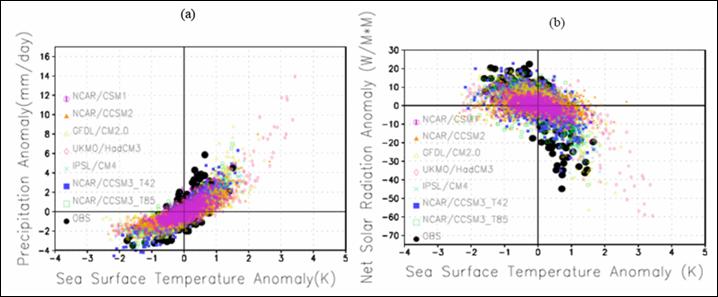
The following figure shows the relationship between the precipitation and the SST (a) and the relationship between the surface solar radiative heating and the SST (b) (Interannual anomalies of these quantities averaged over the equatorial Pacific (5S-5N, 150E-250E) and for the period July 1983—June 2001 [http://www.esrl.noaa.gov/psd/people/dezheng.sun/dspapers/Sun-Yu-Zhang-JC-revised.pdf]) These figures compare the observations (black dots) with the output from various climate models (colored dots). The study states this confirms “common bias existing in the climate models: the overestimate of the positive feedback of water vapor. … all the models have a stronger water vapor feedback than that indicated in observations.”
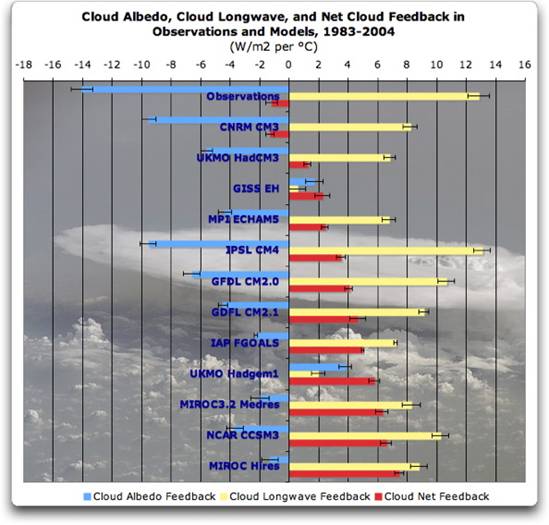
The above paper also states: “A more serious concern raised by the study of Sun et al. (2006) is the finding of a common bias in the simulation of the cloud albedo feedback in the leading climate models: with the exception of the GFDL model, all the models they analyzed in that study underestimate the response of cloud albedo to the surface warming.” The paper provides a table of observations and model results, which has been plotted by Willis Eschenbach as shown below. The red bars indicate the net feedback – the observations show a negative feedback but only one model shows a negative feedback.
[http://wattsupwiththat.files.wordpress.com/2010/12/solar-longwave-and-net-cloud-forcing.jpg]
|
|
Clouds and Heat Transport
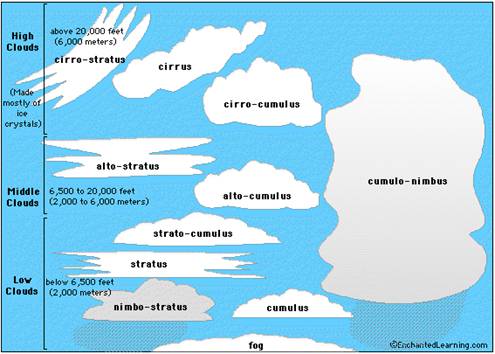
There are various types of clouds (as shown in the following figure) and one of the most important types is cumulonimbus, which form from near ground level up to 75,000 feet. Most of the sun’s radiation reaches the Earth in the tropics. Cumulonimbus clouds act as heat engines, extracting energy from the ocean and lower layers of the tropical atmosphere and funneling the heat and moisture upward and outward.
[http://www.enchantedlearning.com/subjects/astronomy/planets/earth/clouds/]
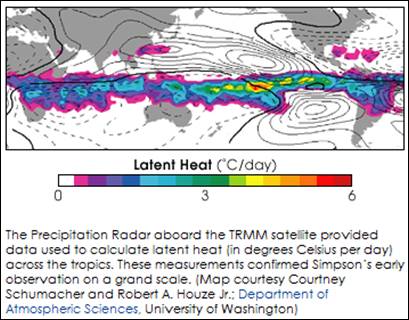
The following figure shows the latent heat carried upwards by tropical clouds from TRMM satellite data (when water evaporates it absorbs energy which is then released when it condenses – this is the latent heat carried from the surface high into the atmosphere, where it then radiates to space).
[http://earthobservatory.nasa.gov/Features/Simpson/simpson6.php]
A NASA Earth Observatory article from 2002: “After examining 22 years of satellite measurements, NASA researchers find that more sunlight entered the tropics and more heat escaped to space in the 1990s than in the 1980s. Their findings indicate less cloud cover blocked incoming radiation and trapped outgoing heat. "Since clouds were thought to be the weakest link in predicting future climate change from greenhouse gases, these new results are unsettling," said Dr. Bruce Wielicki of NASA Langley Research Center, Hampton, Va. ... "It suggests that current climate models may, in fact, be more uncertain than we had thought," Wielicki added. … The previously unknown changes in the radiation budget are two to four times larger than scientists had believed possible. ... The faster circulation dried out the water vapor that is needed for cloud formation in the upper regions of the lower atmosphere over the most northern and southern tropical areas. Less cloudiness formed allowing more sunlight to enter and more heat to leave the tropics. In response, several of the world's top climate modeling research groups agreed to take on the challenge of reproducing the tropical cloud changes. But the climate models failed the test, predicting smaller than observed variability by factors of two to four. "It's as if the heat engine in the tropics has become less efficient using more fuel in the 90s than in the 80s," said Wielicki. "We tracked the changes to a decrease in tropical cloudiness that allowed more sunlight to reach the Earth's surface. But what we want to know is why the clouds would change." The results also indicate the tropics are much more variable and dynamic than previously thought. "We think this is a natural fluctuation, but there is no way to tell yet." [http://earthobservatory.nasa.gov/Newsroom/view.php?old=200201317366]
|
|
Tropical Cloud Cover and Global Temperature
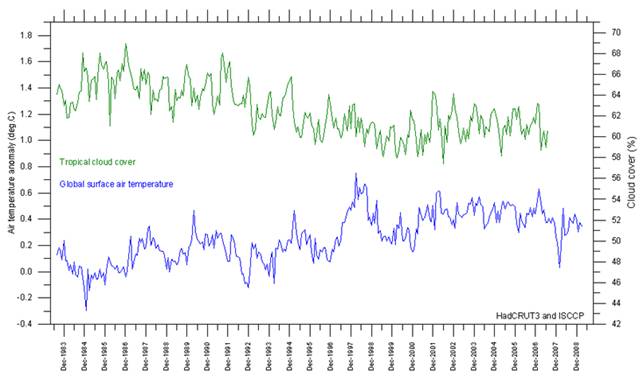
The following figure shows tropical cloud cover (15N - 15S, green) and global monthly average temperature anomaly (blue) for 1983 - 2008 (from [http://www.climate4you.com/ClimateAndClouds.htm] where the cloud data is from ICCP and the HadCRUT3 data).
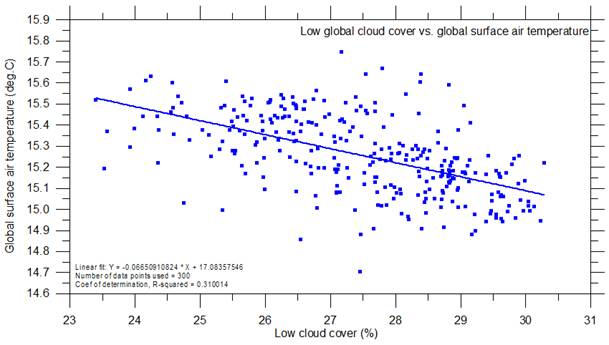
The following figure shows the correlation between global low cloud cover and global surface air temperature (from same source as above). As low cloud cover increases, net temperature decreases.
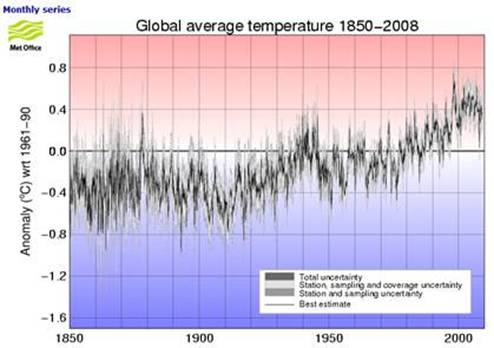
The following figures show global average temperature anomalies (from [http://hadobs.metoffice.com/hadcrut3/diagnostics/global/nh+sh/])
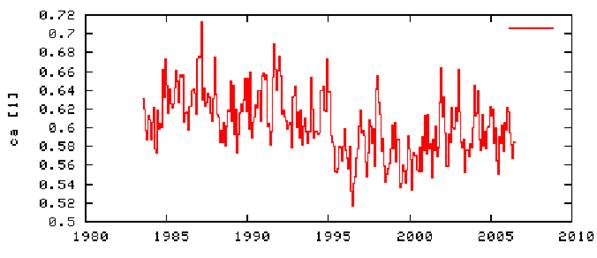
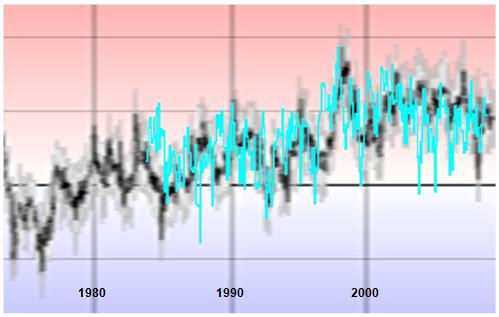
The following figure shows total cloud cover for the Pacific Ocean area of 20N – 20S x 90W – 120E from the ICCPS database plotted at the KNMI climate explorer [http://climexp.knmi.nl/start.cgi?someone@somewhere]. (The ICCPS is the International Satellite Cloud Climatology Project with data starting in 1983 [http://isccp.giss.nasa.gov/].)
The following figure shows the cloud cover from above (inverted and changed to blue) and superimposed on the global average temperature graph shown previously. Thus tropical Pacific cloud cover has a strong correlation with global average temperature.
|
|
Cloud Data Sites
ISCCP Monthly Cloud Data Graphs: http://isccp.giss.nasa.gov/climanal1.html
Monthly Global Cloud Maps: http://earthobservatory.nasa.gov/GlobalMaps/view.php?d1=MODAL2_M_CLD_FR#
|
|
|