Global Warming Science -
www.appinsys.com/GlobalWarming
Climate Regime Shifts: Related to Geomagnetic Storms
[last update: 2010/08/03]
Climate Regime Shifts
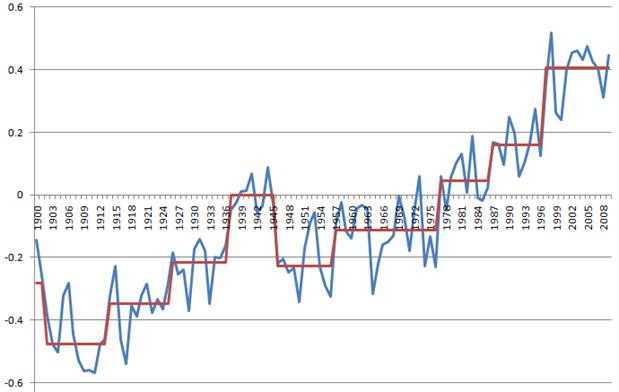
The identification of climate regime shifts in the global temperature
anomaly data was discussed on the climate regime shift page [http://www.appinsys.com/GlobalWarming/ClimateRegimeShift.htm]
including the timing with the solar cycle. The following figure shows
the regime shifts identified in the Hadley HadCRUT3 annual data from
that page.
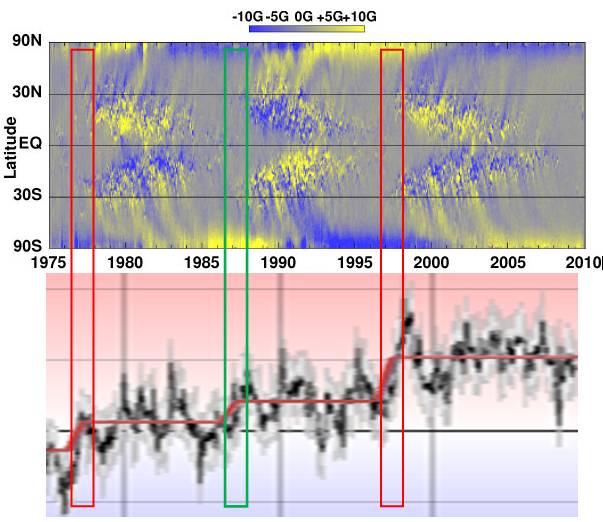
The following figure (also from the original climate shift page)
shows the longitudinally averaged solar magnetic field. This “magnetic
butterfly diagram” shows that the sunspots are involved with
transporting the field in its reversal. The Earth’s temperature regime
shifts are indicated with the superimposed boxes – red on odd numbered
solar cycles, green on even [http://solarphysics.livingreviews.org/open?pubNo=lrsp-2010-1&page=articlesu8.html]
The following sections compare the climate regime shifts with solar
geomagnetic phenomena.
Solar Geomagnetic Ap Index
The Ap Index was introduced in 1975. “It
is computed as the 8-point running average of successive 3-hourly ap
magnetic activity indices. When the average rises above an arbitrary
threshold (usually 40), a major magnetic storm is considered to be in
progress. While the running average stays above the threshold, it is
considered one storm.” [http://www.scostep.ucar.edu/archives/scostep11_lectures/Allen.pdf]
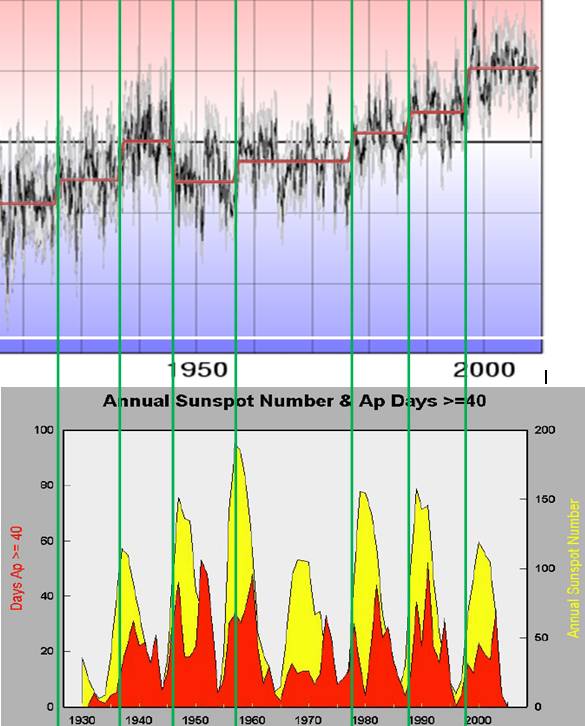
The following figure compares the identified regime shifts to the Ap
Days >= 40 (red) from that report. The regime shifts correspond to the
ramping up from a minimum in the ApD40.
Geomagnetic Kp Index / Geomagnetic Storms
The Kp index was introduced in 1949 based on the disturbance levels
in the horizontal magnetic field components and subsequently extended
back to 1932 [http://www-app3.gfz-potsdam.de/kp_index/description.html].
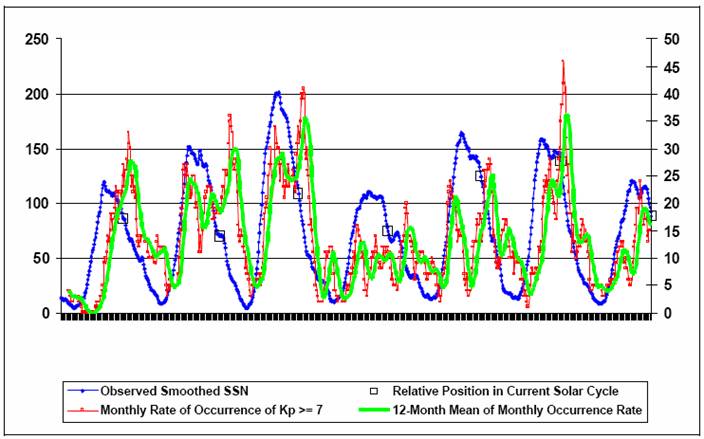
The following figure shows the monthly rate of occurrence of severe
geomagnetic storms (i.e. with Kp > 7) (red) and the 12-month moving
average of of the same (green), along with sun spot number (blue) [http://www.spacew.com/gic/guidance.pdf].
The following figure combines the above figure with the solar
cycle butterfly diagram and the global monthly temperature anomaly.
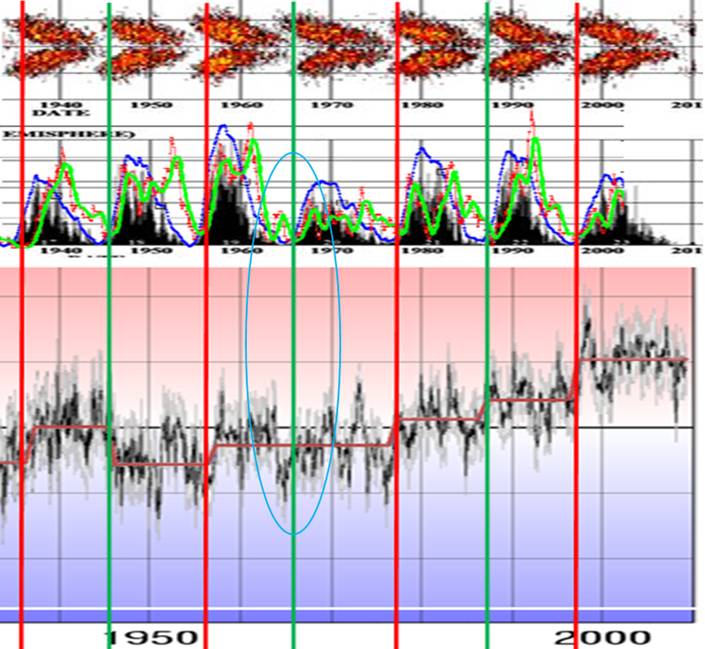
An interesting coincidence: the temperature regime shifts occur when
the decreasing geomagnetic storm rate crosses the increasing sun spot
number. The only solar cycle without an identified regime shift at its
onset is solar cycle 20, starting in 1966. It is coincidental that the
decreasing geomagnetic storm rate occurs earlier than usual and it makes
a double dip. This is highlighted by the blue circle above.
Geomagnetic aa Index
The aa index is based on 3-hour antipodal geomagnetic observations in
Britain in the Northern Hemisphere and locations in Australia in the
Southern Hemisphere.
Cliver et al ("Solar variability and climate change: Geomagnetic aa
index and global surface temperature", Geophysical Research Letters,
Vol.25, 1998) state: "During the past
~120 years, Earth's surface
temperature is correlated with both decadal averages and solar cycle
minimum values of the geomagnetic aa index. The correlation with aa
minimum values suggests the existence of a long-term (low-frequency)
component of solar irradiance that underlies the 11-year cyclic
component. … the general similarity in the time-variation of Earth's
surface temperature and the low-frequency or secular component of the aa
index over the last ~120 years supports other studies that indicate a
more significant role for solar variability in climate change on decadal
and century time-scales than has previously been supposed."
[http://www.agu.org/pubs/crossref/1998/98GL00499.shtml]
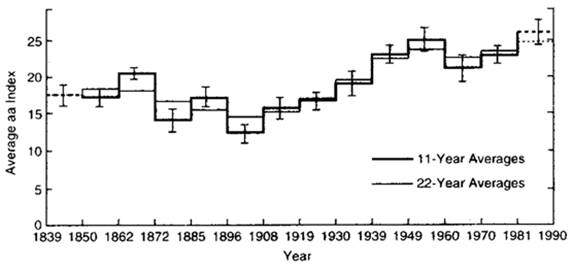
The following figure shows “the
"11-year" solar cycle average of the aa index beginning two years
after solar maximum (heavy line), together with the double solar
cycle average which removes the "22-year" periodicity.
(From Russell and Mulligan “The 22-year Variation of Geomagnetic
Activity: Implications for the Polar Magnetic Field of the Sun”, 1995 [http://www-ssc.igpp.ucla.edu/personnel/russell/papers/731/731index.htm])
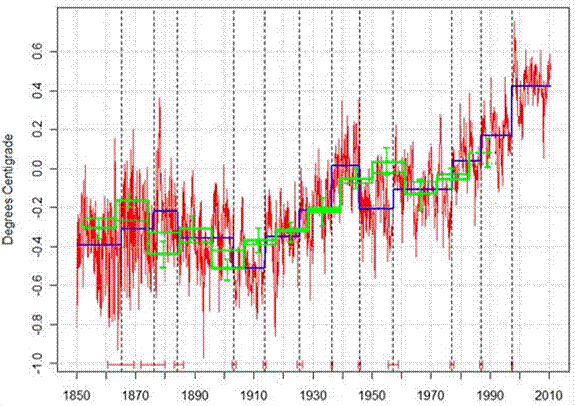
The following figure shows the above average aa index lines changed to
green and superimposed on the regime changes identified by Rich using R-strucchange
(blue) and the monthly HadCRUT3 anomaly data (red). The regimes are out
of sync with the averages since the averages were based on starting “two
years after solar maximum”.
The aa 11-year averages have a good correspondence to the temperature
trends and shifts (although this 11-year average plot only goes to 1990).
Leif Svalgaard
et al developed “a
new simplified daily index of geomagnetic activity [IHV] that is well
suited for studies of the long-term variability of solar-terrestrial
interactions.”
[http://www.leif.org/research/IHV%20-%20a%20new%20long-term%20geomagnetic%20index.pdf]
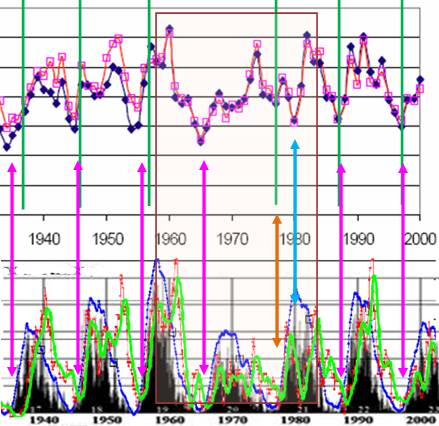
The following figure compares the regime shifts identified previously
with the geomagnetic aa index from the Svalgaard paper (aa index in dark
blue, aa index reconstructed from IHV in pink).
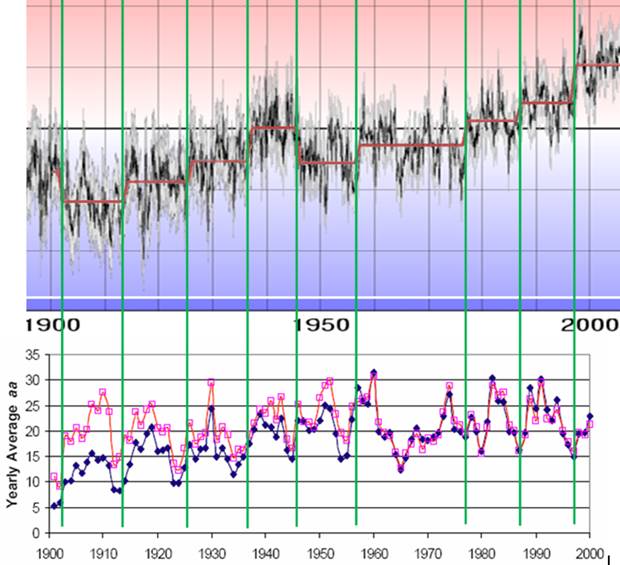
The above shows a strong correspondence between the regime shifts and
the start of the rise of the aa index from each minimum. The exception
is the 1965 minimum and the 1977 shift leads the 1980 minimum. This
1960-1980 timeframe is highlighted below comparing it to the Kp > 7 rate
shown previously. The early 1960s – late 1970s was an unusual solar
cycle in terms of Kp storms. The magenta arrows indicate the typical
coincidence of the aa index minimum with the crossing of the sunspot /
Kp7 storm lines. The aa index / Kp7 storm crossing get out of sync in
the 1970s, although the 1977 regime shift matches the Kp7-SSN crossing.
This indicates that the Kp7 is more correlated to the climate regime
shifts than the aa index.
Comparison of Regime Shifts With Temperature Using Hodrick-Prescott
Filtering
In 2009 Basil Copeland and Anthony Watts did an analysis involving a
Hodrick-Prescott filter on the monthly HadCRUT anomaly data [http://wattsupwiththat.com/2009/05/23/evidence-of-a-lunisolar-influence-on-decadal-and-bidecadal-oscillations-in-globally-averaged-temperature-trends/]
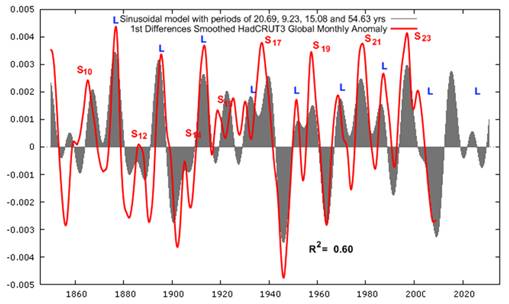
The following figure is from that analysis, showing the first
differences of trend component smoothed (red line) as well as the result
of a sinusoidal model (gray).
The following figure compares the regime shifts identified previously
with the first differences smoother (red) line from the above graph.
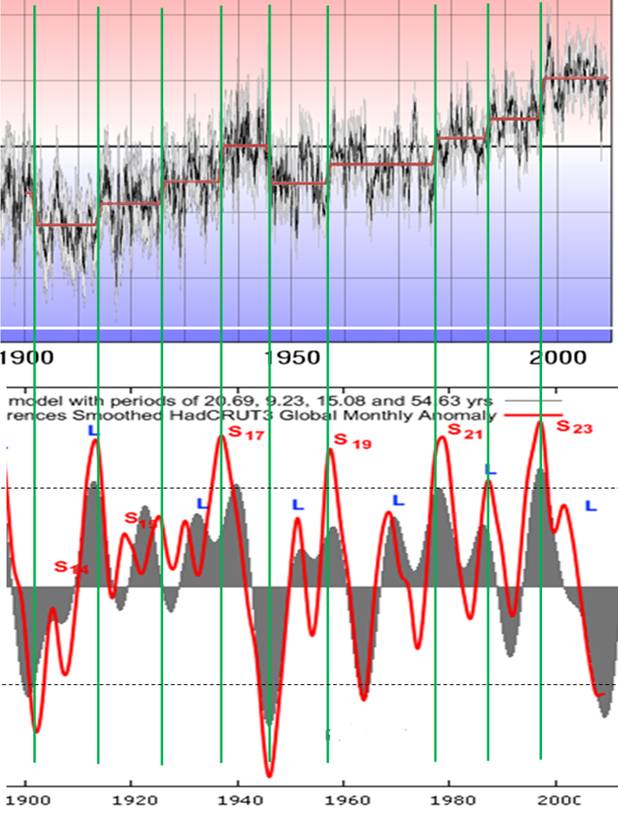
The regime shifts occur whenever the first difference curve is >
+/-0.0025 (indicated by the dotted lines on the lower graph above).
There are two exceptions: 1) a regime shift was identified in 1926 when
the first difference curve has low oscillations not reaching the 0.0025
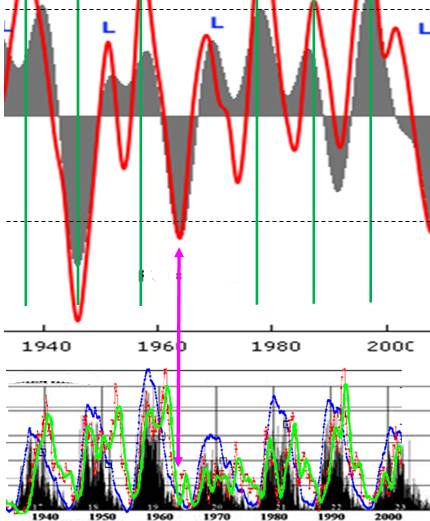
level; 2) no regime shift was identified in 1963 when the first
difference line slightly crossed the -0.0025 level. The 1964 temperature
drop corresponded to an unusual drop in the rate of Kp > 7 as shown
below.
Sunspot cycle 21 was unusual: “A
very unusual thing occurred in cycle 21 when aa had two minima, one in
November 1976 (five months after the Rz(min) of June 1976), and another
several years later, in March 1980.”
[http://hal.archives-ouvertes.fr/docs/00/31/71/67/PDF/angeo-20-1519-2002.pdf]
The following figure is from that paper showing the initial aa index
minimum (DE in 1976) corresponding to the regime shift and orange arrow
above, and the later lower minimum (MA in 1980) as indicated by the blue
arrow above.

Conclusion:
The evidence indicates that the climate regime shifts identified
correspond to the interaction of decreasing geomagnetic storms (Kp > 7)
with increasing sunspot area.
(2010080301)


