www.appinsys.com/GlobalWarming
Archaeology Magazine Promoting Global Warming Alarmism
[last update: 2009/03/03]
Archaeology Magazine, which until now has been able to remain focused on the science of archaeology, has now succumbed to popular scaremongering (Andrew Curry: “Climate Change: Sites in Peril”, Archaeology, March/April 2009 http://www.archaeology.org/0903/etc/climate_change.html ).
The focus of the article is on human (anthropogenic) CO2 based climate change and the alarmist position. This is clear since it states in the introduction that the IPCC “estimates that the world’s temperature has risen about two degrees in the past century, thanks in part to an increase in carbon dioxide … The worst case scenario is truly frightening: a 10-degree rise in global temperatures causing ice caps to melt and sea levels around the world to rise more than three feet.”
The IPCC does not make the claims stated in the Archaeology magazine introduction. First of all, the IPCC claims that CO2 affects temperatures only since 1970. The following figure is from the IPCC AR4, with global temperatures superimposed. It shows the output of multiple runs of multiple climate models: blue band – using only natural climate forcings, and pink band – including anthropogenic CO2. One thing that is clear is that the models only require the inclusion of CO2 after 1970. In other words, according to the IPCC, warming prior to 1970 can be explained by natural causes. This is an important point since many people are mislead into thinking that the official IPCC position attributes the 20th century warming to CO2, which is not the case.
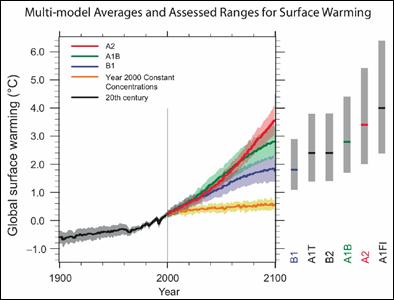
Secondly, the projections of future warming under various scenarios have as the highest probability case, a warming of less than 2 degrees over the next century. The following figure is from the IPCC AR4 showing outputs of climate models for various future scenarios. It does not show the probability levels, but even at its most extreme case comes nowhere near the 10 degrees as claimed in the article.
The Intergovernmental Panel on Climate Change (IPCC) was founded in 1988 by the United Nations Environment Program and the World Meteorological Organization, with the purpose of assessing “the scientific, technical and socioeconomic information relevant for the understanding of the risk of human-induced climate change.” In other words the organization is built on the a priori assumption of “human-induced climate change” [http://www.appinsys.com/GlobalWarming/GW_Part7_PoliticalConsensus.htm].
The IPCC is political in nature. “Its key document, “Summary for Policymakers,” is written by a committee composed mostly of representatives of governments and advocacy groups. Few scientists have a role in crafting that paper, which is all that most policy-makers read.” [http://popecenter.org/commentaries/article.html?id=2139] (Also see, Richard Lindzen, Professor of Meteorology at MIT: http://ecoworld.com/features/2008/10/30/climate-science-is-it-currently-designed-to-answer-questions/ for a discussion of the politicization of climate science and the IPCC).
The following sections address the actual climate data for each of the focus items in the Archeology Magazine article. The problem is mainly conflation of localized conditions with a hypothetical anthropogenic CO2 based cause of global warming.
|
|
Thawing Scythian Tombs
The focus is on burial mounds (kurgans) – frozen tombs threatened by melting permafrost.
(See this document for actual archaeology of the kurgans: http://whc.unesco.org/uploads/news/documents/news-433-1.pdf )
NOAA maintains a database of global temperature stations (the Global Historical Climate Network – GHCN). There are no long-term temperature stations in the region. The only station in the GHCN database with data going back as far as the early 1950’s is Altay.
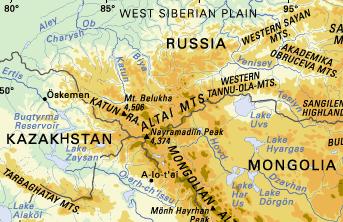
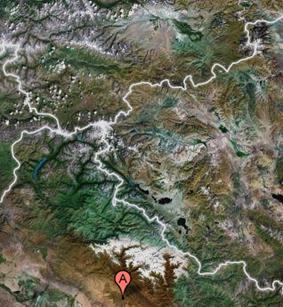
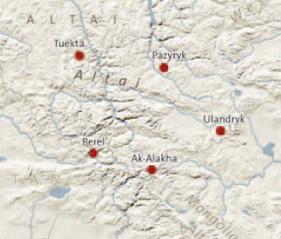
The following images show: location of Altai Mountains (left) and location of Altay temperature station (center, marked with A on red symbol) and major kurgan sites (right).
The following figure shows the annual mean temperature (left) and the January mean temperature (right) for Altay. Warming is evident in the annual mean until the year 2000. With only 50 years of data, no long-term indication of trends exist. (NOAA data plots made at: http://www.appinsys.com/GlobalWarming/climate.aspx)
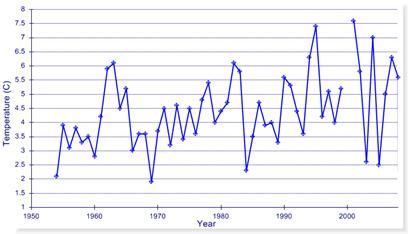
Annual Mean Temperature
The following figures show January/February mean temperature (leftt) and the July/August mean temperature for Altay. Warming is evident in the January/February mean until the year 1980 The although there is no warming trend since then. The July/August mean shows a slight cooling trend.
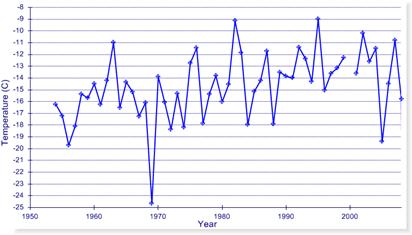
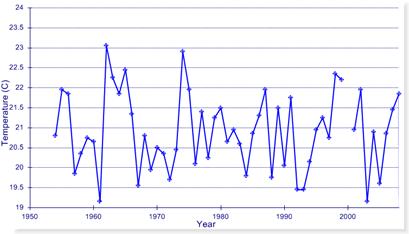
January/February Mean Temperature July/August Mean Temperature
The following figure shows the monthly mean temperature (blue) along with the January mean temperature (red). There is no trend evident in either the summer or winter temperatures. Poor data recording is evident from the mid-1990s to the early 2000s.
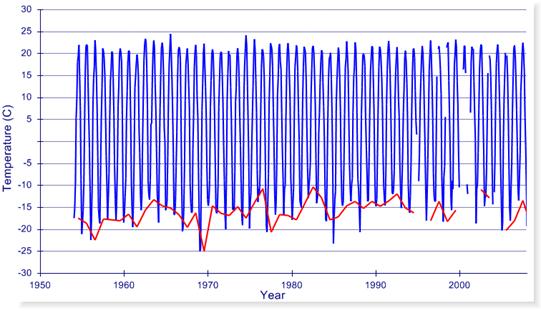
Monthly Mean Temperature (blue) and January Mean Temperature (red)
The Archeology Magazine article states: “The glaciers that covered the slopes of the Altai are receding and even disappearing.” This is similar to glaciers throughout most of the world – they have been receding since the Little Ice Age in the 1700s. The following figure shows the recession of the two largest glaciers in the Altai [http://homepages.vub.ac.be/~fpattyn/papers/Pattyn2003_Ann37.pdf]. They have been disappearing since before recording of their position began in the late 1800s – early 1900s. For the largest glacier, the rate of recession has actually slowed down.
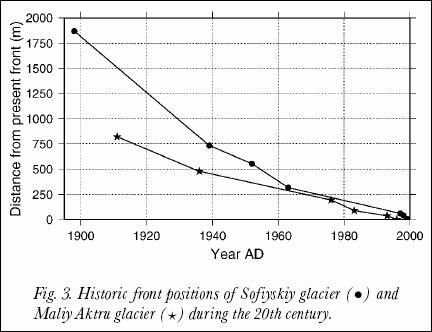
Since according to the IPCC, anthropogenic CO2 has only caused warming since 1970, the recession of the glaciers cannot be due to CO2-induced global warming. Also, since January temperatures have not been increasing since the 1970s, this cannot be attributed to anthropogenic CO2-induced global warming.
A lack of long-term instrumental data in the area makes it difficult to determine whether recent warming is cyclical or on a longer-term trend. A 2007 study (Andreev, Pierau, Kalugin, Daryin, Smolyaninova and Diekman, “Environmental changes in the northern Altai during the last millennium documented in Lake Teletskoye pollen record”, Quaternary Research Vol 67, 2007 [http://www.sciencedirect.com/science?_ob=ArticleURL&_udi=B6WPN-4MR1K7G-1&_user=10&_rdoc=1&_fmt=&_orig=search&_sort=d&view=c&_acct=C000050221&_version=1&_urlVersion=0&_userid=10&md5=784b6911da31fdcc8dd14ffe3a3fd40a] states “A high-resolution pollen record from Lake Teletskoye documents the climate-related vegetation history of the northern Altai Mountain region during the last millennium. … between ca. AD 1050 and 1100. The climate was similar to modern. In the beginning of the 12th century, [evidence] point to colder and more arid climate conditions than before … Around AD 1200, regional climate became warmer and more humid than present … Climatic conditions were rather stable until ca. AD 1410. … slightly drier climate conditions between AD 1410 and 1560. …further deterioration of climate conditions between AD 1560 and 1810, consistent with the Little Ice Age. After AD 1850 the vegetation gradually approached the modern one, in conjunction with ongoing climate warming.”
So, from 1200 – 1400 the Altai was “warmer and more humid than present” and the current warming period has been occurring since the early 1800s, since the Little Ice Age.
|
|
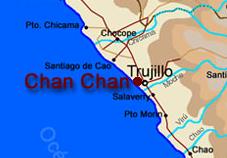
Peru’s Rainstorms
The focus is on ruins threatened by heavy rainfall. This one attributes the heavy rainfall of 1998 to the severe El Nino of that year. Although there is no known connection between El Nino and anthropogenic CO2 global warming, the author chose to conflate the phenomena.
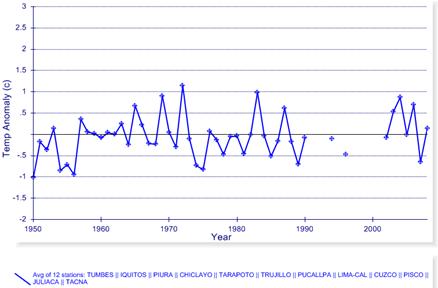
The following figure shows the annual mean temperature for the average of all 12 “long-term” stations in Peru (in this case unfortunately not actually long-term, but since 1950) stations in the NOAA GHCN database. No warming trend.
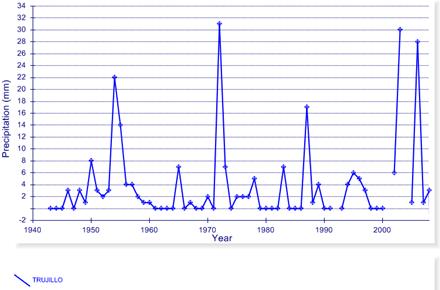
The article mentions Chan Chan as an archaeological site threatened by erosion due to precipitation. Chan Chan is 5 km from Trujillo. Unfortunately there is a lot of missing data in the NOAA GHCN records for Peruvian stations. The following figure shows total annual precipitation for Trujillo – the closest station to Chan Chan.
The following figure shows the estimated solar output reaching the earth (upper figure) [http://www.giss.nasa.gov/research/briefs/shindell_03/] as well as the same plot (changed to green) superimposed on the El Nino / Southern Oscillation (ENSO) [http://www.cdc.noaa.gov/people/klaus.wolter/MEI/]. The declining solar irradiance from 1958 to 1975 corresponds to a general decreasing trend in the ENSO, followed by a shift to mainly positive values following the Pacific climate shift of 1976/77. The solar – El Nino connection is stronger than any evidence based on CO2.
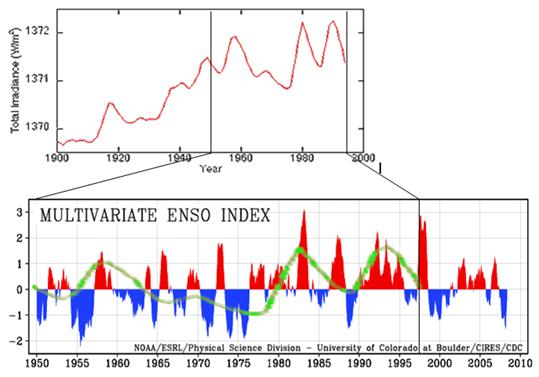
See http://www.appinsys.com/GlobalWarming/ENSO.htm for more information about El Nino.
While these types of ruins are being deteriorated by rainfall, it is misleading for the author to conflate the El Nino phenomenon with anthropogenic CO2 based global warming, since there is no scientific basis for doing so. One of the leading proponents of belief in anthropogenic CO2 – Kevin Trenberth says [http://www.ucar.edu/communications/quarterly/winter97/connection.html] : “We would normally use models to pin down what the effects would be, however the models we have are not really good enough to answer our questions … But even though we can't trace the link between the changes in ENSO and NAO and global warming, Trenberth believes, "There's got to be a connection”. This is what it comes down to – belief.
A study published in 2006 (Nyenzi and Lefale, World Meteorological Association, “El Nino Southern Oscillation (ENSO) and global warming”, Advances in Geosciences 6, 95-101, 2006 [http://hal.archives-ouvertes.fr/docs/00/29/69/12/PDF/adgeo-6-95-2006.pdf]) states: “Although ENSO simulations in AOGCM have improved in recent years, further model enhancements are required to simulate a more realistic Pacific climatology and seasonal cycle as well as more realistic ENSO variability. … In terms of the connection between ENSO and global warming, the scientific literature provides insufficient evidence to date to suggest any direct link between the recent observed increase in ENSO episodes and global warming. … We conclude there is insufficient evidence to date to suggest any changes in the intensity or frequency of ENSO as a consequence of global warming.”
|
|
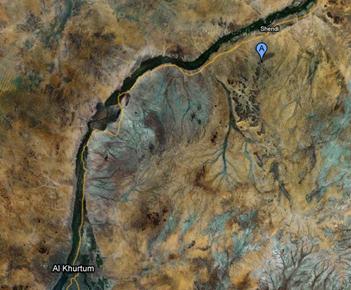
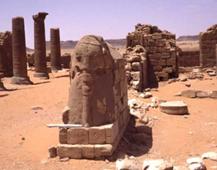
Sudan Desertification
The focus is on ruins threatened by blowing sand. This one attributes the sand to global warming. One of the main focus locations of the article is al Musawarat. The following figures show: left – location of Musawarat maked with the blue A, and two photographs of ruins at the location.

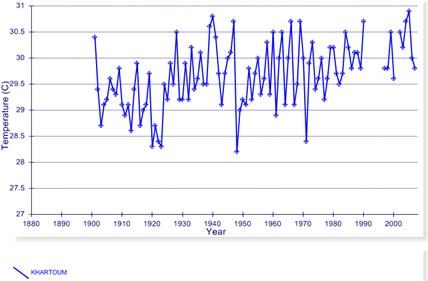
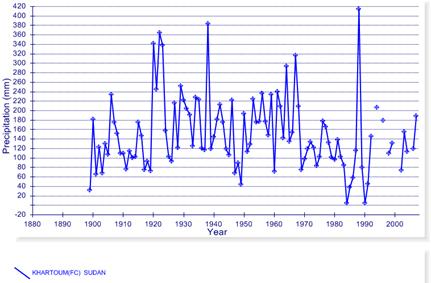
Khartoum is the closest station in the NOAA GHCN database (and the only one with long-term data). The following figures show the average annual temperature in Khartoum (left) and total annual precipitation (right). The area has experienced warming over the last few decades as well as low precipitation, although the precipitation is recovering since the 1980s.
The rainfall in the edge of the Shara desert (the Sahel) is known to be related to the Atlantic Multidecadal Oscillation (AMO). The following figure is from a study (Zhang and Delwoth, “Impact of Atlantic Multidecadal Oscillations on India/Sahel Rainfall and Atlantic Hurricanes”, Geophysical Research Letters, Vol. 33, 2006) [http://www.gfdl.noaa.gov/reference/bibliography/2006/roz0603.pdf] showing the correspondence between the AMO (a) and the Sahel rainfall (b).
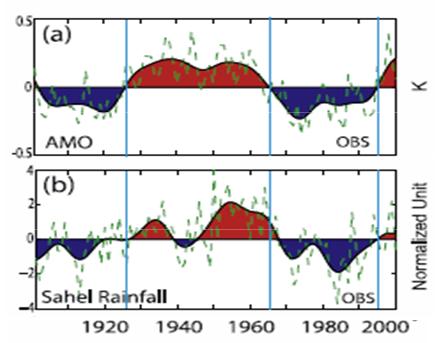
See www.appinsys.com/GlobalWarming/PDO_AMO.htm for more information on the AMO.
The Sahel region had a long period of declining rainfall from the early 1950s to the 1980s, with increasing rainfall since 1985, as shown in the following figure showing deviation from mean precipitation for 1900 to 2000 [http://www.eoearth.org/article/Greening_of_the_Sahel].
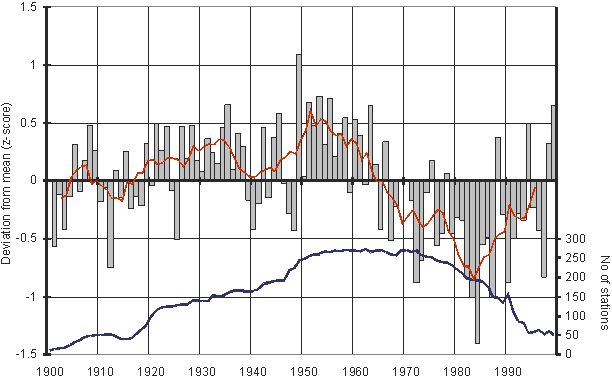
Sahel Rainfall and number of stations providing data
Since the lowest point in the rainfall in the 1980s, the vegetation has been increasing in the Sahel. The following figure shows the Normalized Difference Vegetation Index (NDVI), showing substantial increases throughout most of the region. [http://www.eoearth.org/article/Greening_of_the_Sahel].
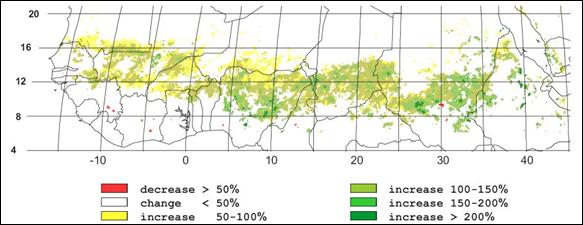
NDVI (Normalized Difference Vegetation Index) 1982 - 1999
The United Nations does not consider Sudan’s desertification to be due to global warming. The United Nations Environment Programme report: “Environmental Degradation Triggering Tensions and Conflict in Sudan” [http://www.unep.org/Documents.Multilingual/Default.asp?DocumentID=512&ArticleID=5621&l=en] states the following:
· The most serious concerns are land degradation, desertification and the spread of deserts southwards by an average of 100km over the past four decades. These are linked with factors including overgrazing of fragile soils by a livestock population that has exploded from close to 27 million animals to around 135 million now. Many sensitive areas are also experiencing a "deforestation crisis" which has led to a loss of almost 12 per cent of Sudan's forest cover in just 15 years. Indeed, some areas may undergo a total loss of forest cover within the next decade.
· The crisis is being aggravated by degradation of water sources in deserts known as wadis or oases. "Virtually all such areas inspected by UNEP were found to be moderately to severely degraded, principally due to deforestation, overgrazing and erosion,"
· The most devastating floods occur on the Blue Nile, as a result of deforestation and overgrazing in the river's upper catchment. Riverbank erosion due to watershed degradation and associated flooding is particularly destructive and severe along the fertile Nile riverine strip.
· The environmental impacts of many of the camps is high, especially in respect to deforestation for fuel wood. The UNEP study found that in Darfur, extensive deforestation can be found as far as 10km from a camp. The situation is being aggravated by brick making in some camps.
· "At the regional level, two-thirds of the forests in north, central and eastern Sudan disappeared between 1972 and 2001. In Darfur, a third of the forest cover was lost between 1973 and 2006. Southern Sudan is estimated to have lost 40 per cent of its forests since independence and deforestation is ongoing," This is largely driven by slash and burn agriculture and energy demands.
|
|
Retreating Swiss Glaciers
The focus is on glaciers in the European Alps receding and exposing archaeological finds. This one attributes the receding glaciers to global warming, and is amusing since the fact that archaeological finds are being exposed indicates the glaciers weren’t there when the artifacts were left.
The following figure is from a study of 169 receding glaciers worldwide (Johannes Oerlemans, “Extracting a Climate Signal from 169 Glacier Records”, published in Science, 2005). It shows the composite average of up to 169 glaciers (the number varies in different time periods). These indicate the pattern that is consistent for most glaciers worldwide – the recession of the glaciers started at the end of the Little Ice Age in the 1700s.
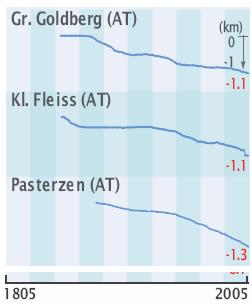
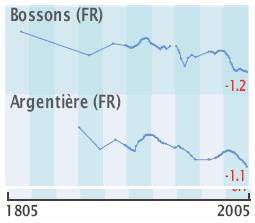
The following figures show glacier recession for several glaciers in the Austrian Alps (left) and French Alps (right) [http://www.grid.unep.ch/glaciers/pdfs/6_5.pdf] showing fluctuating glacial retreat since the 1800s.
The following figure shows the number of advancing glaciers (blue) and retreating glaciers (red) for Central Europe [http://www.grid.unep.ch/glaciers/pdfs/5.pdf]. The figure refers to the Little Ice Age maximum glacier extents in the mid-1800s.
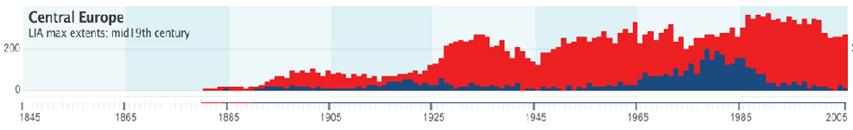
The recession of glaciers started long before the 1970s when the IPCC attributes warming to anthropogenic CO2.
|
|
Channel Islands Erosion
The focus is on rising sea levels around the Channel Islands off the coast of California threatening coastal rock shelters. According to the article: “early Americans were good sailors who reached the islands more than 13,000 years ago. … Back then the … oceans much lower – low enough that four of the Channel Islands were connected by dry land. Now, rising sea levels are threatening some of the last coastal rock shelters”. Interesting how it is “now rising sea levels” even though thousands of years of rising sea levels are implicated by the complete statement. In other words the rising sea level is not simply a recent phenomenon.
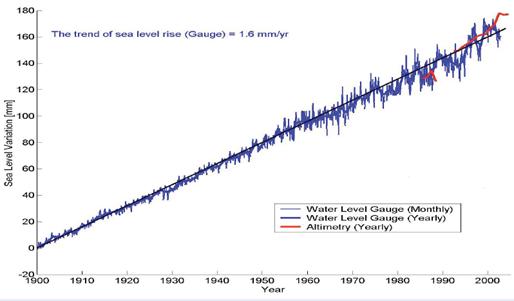
The following figure shows global cumulative sea level change for 1900 to 2002 [http://www.wamis.org/agm/meetings/rsama08/S304-Shum_Global_Sea_Level_Rise.pdf]. Since according to the IPCC, CO2-based warming has apparently only shown up since the 1970s, all of this sea level rise since prior to 1970 cannot be caused by anthropogenic CO2, and yet the trend has not increased.
The following figure shows sea levels for the closest stations to the Channel Islands in the NOAA database [http://tidesandcurrents.noaa.gov/sltrends/index.shtml] Los Angeles has the longest record in the area and for the last 85 years has risen at an average of 0.83 mm / year (= 3.25 inches per century).
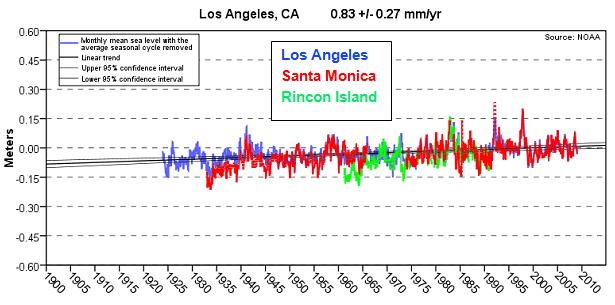
The IPCC stated in the Third Assessment Report (2001) [http://www.grida.no/climate/ipcc_tar/wg1/425.htm]: “There is no evidence for any acceleration of sea level rise in data from the 20th century data”. So it’s not caused by anthropogenic CO2.
|
|
Greenland’s Melting Sea Ice
The focus is on storm surges around Greenland’s north and eastern coast, which can then reach the coast and damage Thule buildings from when they migrated to Greenland 2,000 years ago.
The following figures show the temperature anomalies for the available long-term or recent stations in Greenland (from the NOAA GHCN database) – left: individual stations, right: average of the 8 stations. Temperatures are recently matching those observed in the 1930’s. The next figure compares the average anomalies with the Atlantic Multidecadal Oscillation (AMO). This shows the effect of the AMO on Greenland temperatures. (See www.appinsys.com/GlobalWarming/PDO_AMO.htm for more information on the AMO).
The following figure shows melt-water runoff from Greenland – again the 1930s – 1940s were similar to the current melting [http://polarmet.mps.ohio-state.edu/jbox/pubs/Box_et_al_J_Climate_2006.pdf]
The following figure shows the Icelandic sea ice index [http://www.eoearth.org/article/Sea_ice_in_the_Arctic]. Recent declines are not unprecedented. The Archaeology magazine article recounts: “I’ve been working in Greenland for 30 years now. I can see with my own eyes how it has changed”. The problem with anecdotes is that they are not science. Climate is defined as average weather over 30 years. Had this person been working in Greenland for 100 years, his story would be different. Short term data do not show long-term trends.
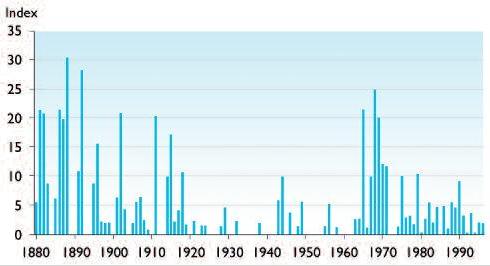
Annual values of the Icelandic sea-ice index
The following figure shows the Icelandic sea ice index from a 2005 report by the Danish Meteorological Institute (“Multi-decadal variation of the East Greenland Sea-Ice Extent: AD 1500-2000”) [http://www.dmi.dk/dmi/sr05-02.pdf].
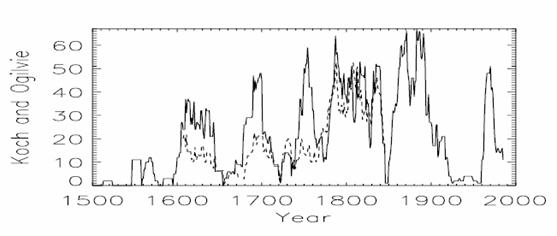
East Greenland / Iceland Sea Ice Index
(See www.appinsys.com/GlobalWarming/RS_Greenland.htm for more information on Greenland)
A 2008 study of the Jakobshavn outlet glacier by an international group of researchers, “Acceleration of Jakobshavn Isbræ Triggered by Warm Subsurface Ocean Waters” (Holland, Thomas, Young, Ribergaard, Lyberth) [http://www.nature.com/ngeo/journal/v1/n10/abs/ngeo316.html] states: “Here we present hydrographic data that show a sudden increase in subsurface ocean temperature in 1997 along the entire west coast of Greenland, suggesting that the changes in Jakobshavn Isbræ were instead triggered by the arrival of relatively warm water originating from the Irminger Sea near Iceland.”
A 2006 paper “Greenland warming of 1920-1930 and 1995-2005” by P. Chylek, M. K. Dubey, and G. Lesins (of Los Alamos National Laboratory, Space and Remote Sensing Sciences, and Department of Physics and Atmospheric Science, Dalhousie University -- published in Geophysical Research Letters 33) [http://www.agu.org/pubs/crossref/2006/2006GL026510.shtml ] provided the following conclusions: “Although there has been a considerable temperature increase during the last decade (1995 to 2005) a similar increase and at a faster rate occurred during the early part of the 20th century (1920 to 1930) when carbon dioxide or other greenhouse gases could not be a cause. The Greenland warming of 1920 to 1930 demonstrates that a high concentration of carbon dioxide and other greenhouse gases is not a necessary condition for period of warming to arise. The observed 1995-2005 temperature increase seems to be within a natural variability of Greenland climate. A general increase in solar activity [Scafetta and West, 2006] since 1990s can be a contributing factor as well as the sea surface temperature changes of tropical ocean [Hoerling et al., 2001]… To summarize, we find no direct evidence to support the claims that the Greenland ice sheet is melting due to increased temperature caused by increased atmospheric concentration of carbon dioxide. The rate of warming from 1995 to 2005 was in fact lower than the warming that occurred from 1920 to 1930.”
Anthropogenic CO2 causing this? Better stick with archaeology Andrew.