Global Warming Science: www.appinsys.com/GlobalWarming
Arctic Oscillation (AO) and North Atlantic Oscillation (NAO)
[last update: 2011/03/02]
|
It is only in recent years that scientists are starting to recognize the influence of atmospheric and oceanic cycles in influencing climate. This document describes the Arctic Oscillation (AO) and the North Atlantic Oscillation (NAO).
According to the National Snow and Ice Data Center the AO and NAO “are different ways of describing the same phenomenon.” [http://nsidc.org/arcticmet/glossary/arctic_oscillation.html] The AO is also referred to as the Northern Annular Mode (NAM).
|
See also the additional documents on:
- Pacific Decadal Oscillation (PDO)
- Atlantic Multi-decadal Oscillation (AMO)
- PDO + AMO Influences
- El Nino / Southern Oscillation (ENSO)
|
|
This document has sections on:
|
|
|
The Arctic Oscillation (AO) is calculated based on seal level pressure differences (now measured by satellite for the 1000 mb height). (See: http://www.cpc.noaa.gov/products/precip/CWlink/daily_ao_index/hgt.shtml )
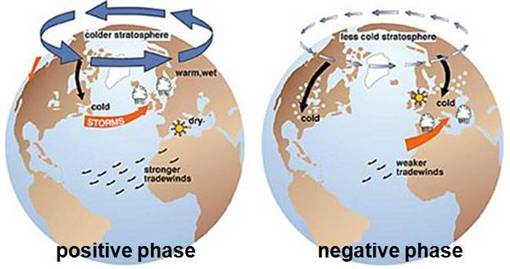
“The AO index describes the relative intensity of a semipermanent low-pressure center over the North Pole. A band of upper-level winds circulates around this center, forming a vortex. When the AO index is positive and the vortex intense, the winds tighten like a noose around the North Pole, locking cold air in place. A negative AO and weak vortex … allow intrusions of cold air to plunge southward into North America, Europe, and Asia. … the index has been mostly positive in wintertime since the late 1980s. The Arctic Oscillation has strengthened in recent decades, contributing to the unusual warmth over the Northern Hemisphere land masses.” [http://www.ucar.edu/communications/newsreleases/2003/deser.html]
The following figures show the effect of positive AO (left) and negative AO (right) [http://biogeo.botanik.uni-greifswald.de/fileadmin/user_upload/_temp_/Martin/lesson/CC_Wilmking_05.ppt]. The colder stratosphere associated with the positive AO results in reduced ozone.
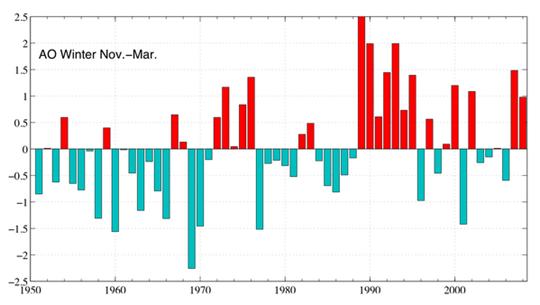
The following figure shows the winter Arctic Oscillation (AO) for 1950 - 2008 [http://www.arctic.noaa.gov/detect/climate-ao.shtml]
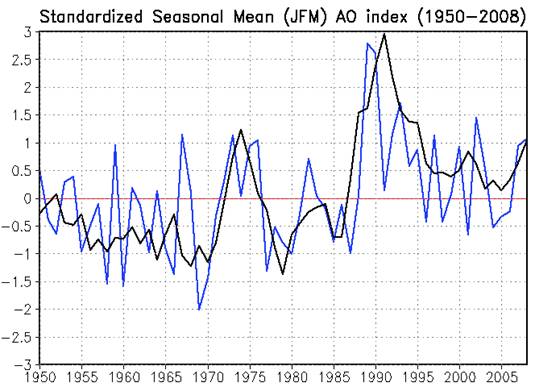
The following figure provides another view of the same data – “the standardized seasonal mean AO index during cold season (blue line) is constructed by averaging the daily AO index for January, February and March for each year. The black line denotes the standardized five-year running mean of the index. Both curves are standardized using 1950-2000 base period statistics.” [http://www.cpc.noaa.gov/products/precip/CWlink/daily_ao_index/JFM_season_ao_index.shtml]
The National Snow and Ice Data Center states: “Over most of the past century, the Arctic Oscillation alternated between its positive and negative phases. Starting in the 1970s, however, the oscillation has tended to stay in the positive phase, causing lower than normal arctic air pressure and higher than normal temperatures in much of the United States and northern Eurasia.” [http://nsidc.org/arcticmet/patterns/arctic_oscillation.html]
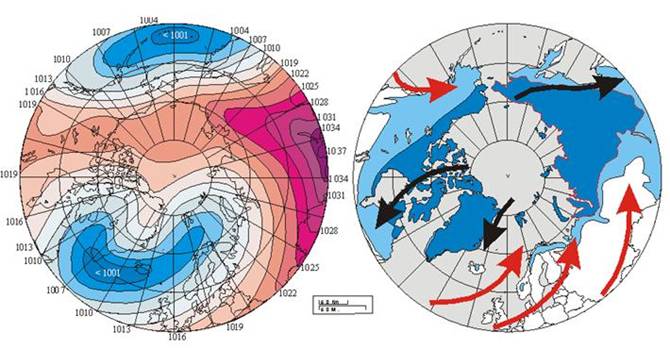
The following figures show: Left: winter (DJF) sea-level pressure (SLP) averaged over the period 1900-2001. The AO index refers to opposing atmospheric pressure patterns in northern middle and high latitudes. The blue areas are low pressure areas. Right: modern distribution of permafrost in the Northern Hemisphere. Continuous permafrost is shown by dark blue colour. Discontinuous and sporadic permafrost is shown by light blue color. Red and black arrows show main surface air flow (warm and cold, respectively) as generated by the 20th century pattern of SLP. The overall wind systems set up by the average winter sea-level pressure appears to represent one of several controls on the present distribution of permafrost in the northern hemisphere. [http://www.climate4you.com/NAOandAO.htm]
An article in Science Daily: “Winds, Ice Motion Root Cause Of Decline In Sea Ice, Not Warmer Temperatures” [http://www.sciencedaily.com/releases/2004/12/041220010410.htm] states: “Extreme changes in the Arctic Oscillation in the early 1990s -- and not warmer temperatures of recent years -- are largely responsible for declines in how much sea ice covers the Arctic Ocean, with near record lows having been observed during the last three years, University of Washington researchers say. It may have happened more than a decade ago, but the sea ice appears to still "remember" those Arctic Oscillation conditions, according to Ignatius Rigor, a mathematician with the UW's Applied Physics Laboratory”
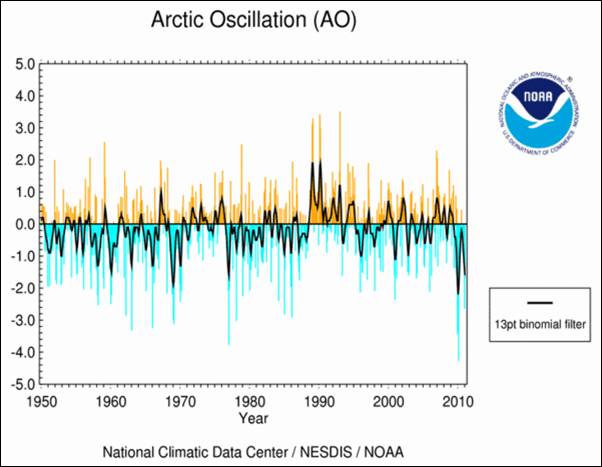
NOAA provides updated monthly AO data at: [http://www.cpc.noaa.gov/products/precip/CWlink/daily_ao_index/month_ao_index.shtml] The following figure is from that page.
A 2010 paper (Ohashu and Tanaka: “Data Analysis of Recent Warming Pattern in the Arctic”, SOLA 2010 Vol 6A [http://www.jstage.jst.go.jp/article/sola/6A/SpecialEdition/1/_pdf] ) states: “variability of the global atmosphere, it is shown that both of decadal variabilities before and after 1989 in the Arctic can be mostly explained by the natural variability of the AO not by the external response due to the human activity”.
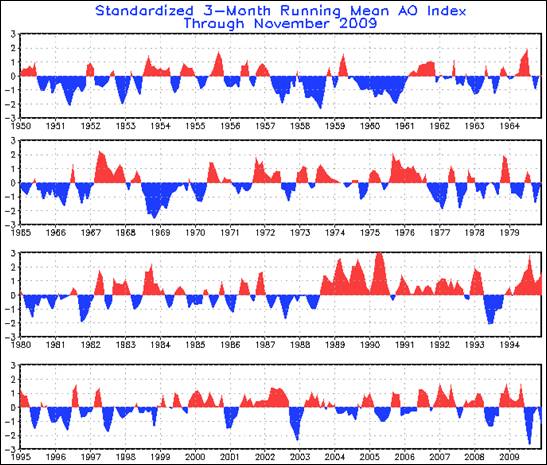
The following figure shows monthly AO (from [http://www1.ncdc.noaa.gov/pub/data/cmb/teleconnections/ao-f-pg.gif]) although the winter AO (JFM) is more typical as this is the period with stronger influence on the Northern Hemisphere weather.
Further information on the Arctic Oscillation can be found at: http://jisao.washington.edu/wallace/ncar_notes/
Daily values of the AO index can be found at: http://www.cpc.noaa.gov/products/precip/CWlink/daily_ao_index/ao_index.html
Monthly AO data can be downloaded from: http://www.cpc.noaa.gov/products/precip/CWlink/daily_ao_index/ao.shtml
|
|
AO and European Glaciers
“The Health of Glaciers: Recent Changes in Glacier Regime” (Meier et al) [http://www.springerlink.com/content/q00627j170621065/]: “Glacier winter balances in north and central Europe correlate with the Arctic Oscillation”
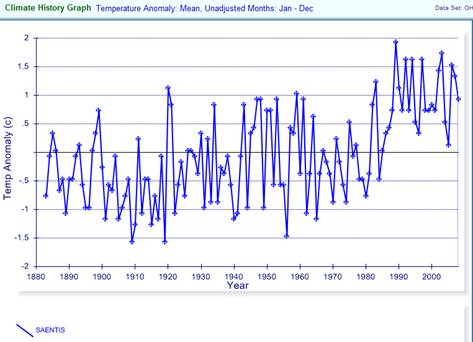
One of the few long-term temperature stations in the Swiss Alps is Saentis – located on the top of a mountain. The following figure shows the annual average temperature anomalies from the NOAA GHCN database. [http://www.appinsys.com/GlobalWarming/climgraph.aspx?pltparms=GHCNT100XJanDecI188020080900110AR64606680000x]
The following figure superimposes the Saentis temperatures from above on the AO shown previously. The Alps regime shift observed in the 1988 time frame is clearly correlated with the abrupt change in the AO.
|
|
The AO had a regime shift in 1988/89, examined in detail along with the AO-solar connections. See: http://www.appinsys.com/GlobalWarming/AO_Regime.htm
|
|
|
|
The North Atlantic Oscillation (NAO)
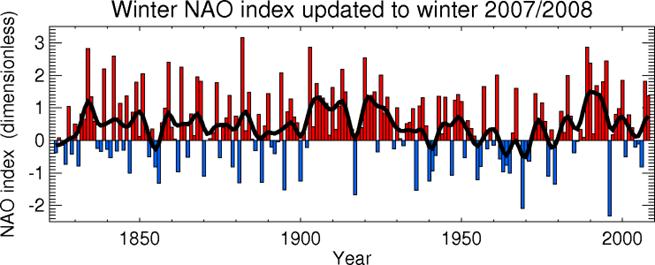
The North Atlantic Oscillation (NAO) is a major mode of atmospheric variability in the Northern Hemisphere, particularly in winter. The NAO index is calculated based on the difference between the normalized sea level pressures over Gibraltar (or Portugal, or the Azores) (subtropical high) and Southwest Iceland (polar low). The following figure shows the winter NAO since 1823 based on Gibraltar. [http://www.cru.uea.ac.uk/~timo/projpages/nao_update.htm]
The following figure shows the winter NAO since 1864 based on Lisbon, Portugal and Reykjavik, Iceland. [http://www.cgd.ucar.edu/cas/jhurrell/Docs/naobook.ch1.pdf]
Updated NAO data can be found at http://ioc3.unesco.org/oopc/state_of_the_ocean/atm/nao.php
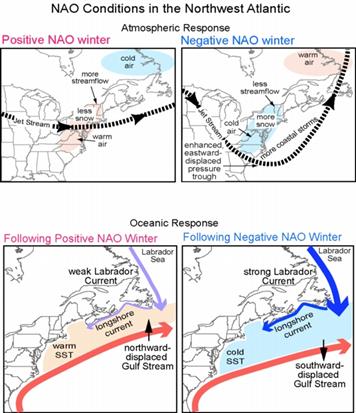
The different phases of the NAO result in different winter conditions over the North Atlantic, with the following general trends [http://www.ldeo.columbia.edu/res/pi/NAO/]:
The following figures show the general patterns of the NAO positive and negative modes (from NOAA Airmap [http://airmap.unh.edu/background/nao.html], which provides a comprehensive explanation of NAO effects on the eastern US).
|
||||||||||
|
Studies of NAO Effects
An article in Science Daily (“North Atlantic Warming Tied To Natural Variability”, Jan 2008 [http://www.sciencedaily.com/releases/2008/01/080103144416.htm]) reported on a Duke University study of North Atlantic temperatures and their relation to the NAO. “while the North Atlantic Ocean's surface waters warmed in the 50 years between 1950 and 2000, the change was not uniform. In fact, the subpolar regions cooled at the same time that subtropical and tropical waters warmed. "It is premature to conclusively attribute these regional patterns of heat gain to greenhouse warming," … water in the sub-polar ocean --- roughly between 45 degrees North latitude and the Arctic Circle --- became cooler as the water directly exchanged heat with the air above it. …NOA[sic] -driven winds served to "pile up" sun-warmed waters in parts of the subtropical and tropical North Atlantic south of 45 degrees” … "We suggest that the large-scale, decadal changes...associated with the NAO are primarily responsible for the ocean heat content changes in the North Atlantic over the past 50 years," the authors concluded.”
Studies have found correlations between NAO and Indian monsoon. The study “Interannual and long-term variability in the North Atlantic Oscillation and Indian summer monsoon rainfall” (Dugam, Kakade and Verma, Indian Institue of Tropical Meteorology, 1997 [http://cat.inist.fr/?aModele=afficheN&cpsidt=2068184]) investigated 108 years of NAO / monsoon data and found that: “The decadal scale analysis reveals that the NAO during winter (December-January-February) and spring (March-April-May) has a statistically significant inverse relationship with the summer monsoon rainfall of Northwest India, Peninsular India and the whole of India. The highest correlation is observed with the winter NAO. The NAO and Northwest India rainfall relationship is stronger than that for the Peninsular and whole of India rainfall on climatological and sub-climatological scales.”
A study of the multi-decadal low frequency oscillation (LFO) of the NAO [http://denali.frontier.iarc.uaf.edu:8080/~igor/research/pdf/50yr_web.pdf] stated: “observations over the past 135 years showed that the recent decrease in ice extent in the Nordic Seas is within the range of natural variability since the 18th century. A combination of century- and half-a-century-long data records and model integrations leads us to conclude that the natural low-frequency oscillation (LFO) exists and is an important contributor to the recent anomalous environmental conditions in the Arctic. There is evidence that the LFO has a strong impact on ice and ocean variability”.
A NASA JPL study (NASA Finds Sun-Climate Connection in Old Nile Records March, 2007 [http://www.jpl.nasa.gov/news/features.cfm?feature=1319]) stated: “Direct measurements of light energy emitted by the sun, taken by satellites and other modern scientific techniques, suggest variations in the sun's activity influence Earth's long-term climate. However, there were no measured climate records of this type until the relatively recent scientific past. The authors suggest that variations in the sun's ultraviolet energy cause adjustments in a climate pattern called the Northern Annular Mode, which affects climate in the atmosphere of the Northern Hemisphere during the winter. At sea level, this mode becomes the North Atlantic Oscillation, a large-scale seesaw in atmospheric mass that affects how air circulates over the Atlantic Ocean. During periods of high solar activity, the North Atlantic Oscillation's influence extends to the Indian Ocean.”
A study of the NAO climate effects on barn swallow breeding (“North Atlantic Oscillation (NAO) effects of climate on the relative importance of first and second clutches in a migratory passerine bird”) http://www3.interscience.wiley.com/journal/118942055/abstract?CRETRY=1&SRETRY=0 “The size of first clutches increased with increasing NAO values, and clutch size increased during the study period. [1970-2000] … in years with high NAO index values first broods were relatively larger than second broods compared to years with low NAO values. Similarly, the breeding success of first relative to second broods was larger in years with high NAO index values compared to years with low NAO values”
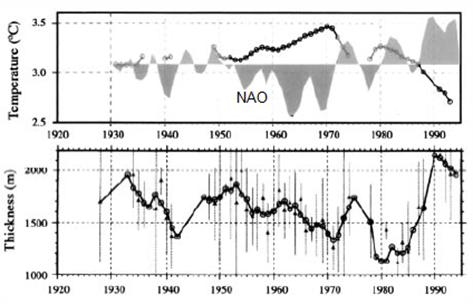
The following figure shows sea surface temperature superimposed on NAO (top) and sea ice thickness (bottom) for the Labrador Sea. [http://www-paoc.mit.edu/paoc/papers/atlantic.pdf]
|
||||||||||
|
NAO and European Glaciers
A study of “Midlatitude Forcing Mechanisms for Glacier Mass Balance” (Reichert, Bengtsson and Oerlemans, Journal of Climate, 2000) [http://www.mpimet.mpg.de/fileadmin/publikationen/Ex72.pdf] states: “The observed strong positive glacier mass balances within 1980-1995 can thus be seen as a consequence of the corresponding observed persistent positive phase of the NAO within this time period. This mechanism will probably also be valid for other maritime Norwegian glaciers which have also shown strong positive mass balances within this period [IASH, 1999].”
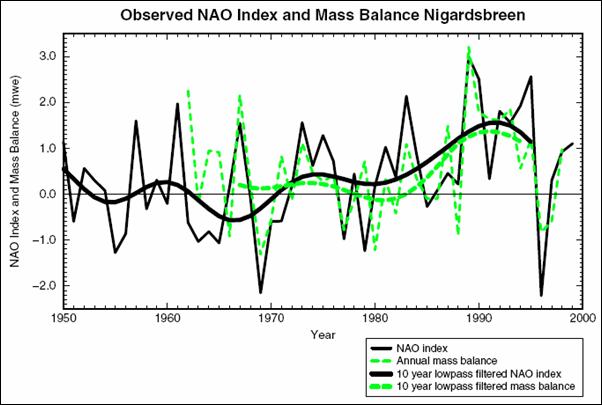
The following figure shows the correlation between the NAO index (black) and the Nigardsbreen Glacier (Norway) mass balance (green).
The same study concludes: “Glacier mass balances of Alpine glaciers have been strongly negative during the decade 1980-1990. The average mass balance value has been -0.65 mwe [Haeberli et al., 1999] resulting in an estimated loss of 10 to 20% of ice volume since 1980 [Haeberli and Beniston, 1998]. The results of the present study indicate that this loss of mass balance can (at least as has been demonstrated for Rhonegletscher) partly be explained by the strong positive phase of the NAO within this time period.”
|
||||||||||
|
|

|
|
|
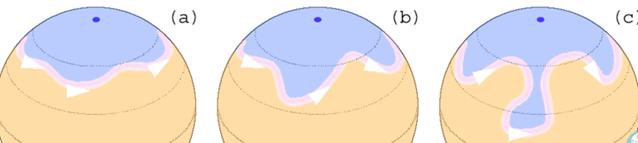
When the polar vortex weakens, the polar jet stream slows and meanders in a form that allows the extension of low pressure lobes much farther to the south. These can become stationary for days and block the normal circulation of the atmosphere. The negative AO/NAO is associated with a slowed polar vortex and polar jet stream. When the jet stream slows, it meanders in a waveform pattern (Rossby waves). The general effect is illustrated below (fromhttp://en.wikipedia.org/wiki/Rossby_wave).
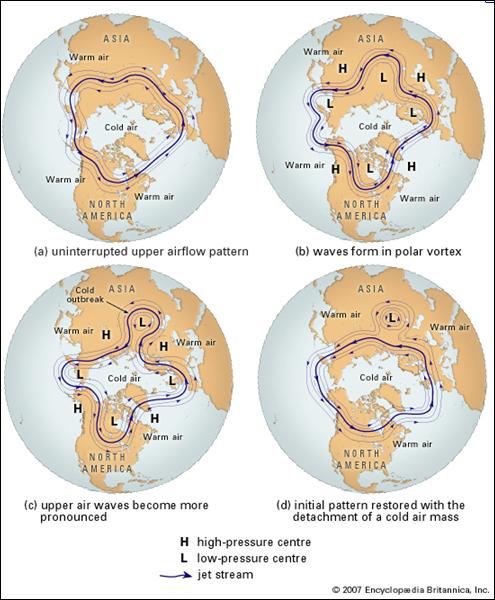
And a polar view (from https://www.britannica.com/EBchecked/topic-art/38479/106997/Rossby-wave-patterns-over-the-North-Pole-depicting-the-formation) showing the blocking pattern in (c)
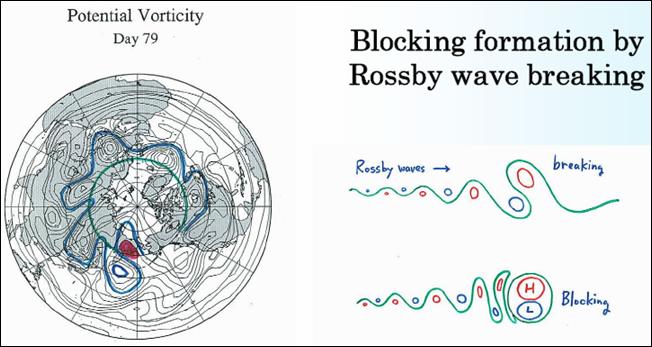
The following figure illustrates the wave breaking to create the blocking pattern (fromhttp://www.apcc21.org/images/Activities/seminar/2006/APCC06-Tanaka.pdf)
“Blocking has a lot to do with the severity of winter weather in the Northern Hemisphere, and the AO has a strong ability to control blocking. To quantify this control, we define a blocking event as a week or more of excess pressure in the midtroposphere together with an anticyclone at the surface. … blocking occurs preferentially during the low AO phase in Alaska, the North Atlantic, and Russia.” [http://www.jisao.washington.edu/wallace/ncar_notes/]
Barriopedro et al (“Solar modulation of Northern Hemisphere winter blocking”, Journal of Geophysical Research, Vol.113, 2008 [http://idl.ul.pt/davidbarriopedro/2008%20Barriopedro%20et%20al.pdf]) found that “Solar activity modulates the preferred locations for blocking occurrence over both Oceans, causing local frequency responses therein. Over the Pacific Ocean high/low solar activity induces an enhanced blocking activity over its eastern/western part. Atlantic blocking occurrence increases for both (high/low) solar phases, with a spatial dependent response confined to western/eastern Atlantic. … Low solar Atlantic blocking episodes last longer, are located further east and become more intense than high solar blocking events.”
Examples of blocking causing unusual weather (which alarmists then blame on global warming):
Russia Heat Wave 2010: http://www.appinsys.com/GlobalWarming/Russia2010.htm
U.S. Cold and Snow January 2011: http://www.appinsys.com/GlobalWarming/USsnow_Jan2011.htm
|
|
|
|
More information on the AO and NAO can also be found at: www.climate4you.com/NAOandAO.htm
|