Global Warming Science: www.appinsys.com/GlobalWarming
Atlantic Multidecadal Oscillation (AMO)
[last update: 2010/01/03]
|
It is only in recent years that scientists are starting to recognize the influence of atmospheric and oceanic cycles in influencing climate.
A 2008 study – “Oceanic Influences on Recent Continental Warming”, by Compo, G.P., and P.D. Sardeshmukh, (Climate Diagnostics Center, Cooperative Institute for Research in Environmental Sciences, University of Colorado, and Physical Sciences Division, Earth System Research Laboratory, National Oceanic and Atmospheric Administration), Climate Dynamics, 2008) [http://www.cdc.noaa.gov/people/gilbert.p.compo/CompoSardeshmukh2007a.pdf] states: “Evidence is presented that the recent worldwide land warming has occurred largely in response to a worldwide warming of the oceans rather than as a direct response to increasing greenhouse gases (GHGs) over land. Atmospheric model simulations of the last half-century with prescribed observed ocean temperature changes, but without prescribed GHG changes, account for most of the land warming. … Several recent studies suggest that the observed SST variability may be misrepresented in the coupled models used in preparing the IPCC's Fourth Assessment Report, with substantial errors on interannual and decadal scales. There is a hint of an underestimation of simulated decadal SST variability even in the published IPCC Report.”
This document describes the Atlantic Multidecadal Oscillation (AMO).
|
See also the additional documents on:
- Pacific Decadal Oscillation (PDO)
- PDO + AMO Influences
- Arctic Oscillation (AO) / North Atlantic Oscillation (NAO)
- El Nino / Southern Oscillation (ENSO)
|
|
|
The Atlantic Multidecadal Oscillation (AMO)
The Atlantic Multi-Decadal Oscillation (AMO) is a fluctuation in de-trended sea surface temperatures in the North Atlantic Ocean. It was identified in 2000 and the AMO index was defined in 2001 as the 10-year running mean of the detrended Atlantic SST anomalies north of the equator. There is a significant negative correlation with US continental rainfall with less rain during a positive AMO index. (H.A. Dijkstra, “On the physics of the Atlantic Multidecadal Oscillation”, Institue for Marine and Atmospheric Research, Netherlands, 2005) [http://www.knmi.nl/publications/fulltexts/drsg2006.pdf]
The AMO has a cycle length of approximately 70 years (i.e. a warm phase plus a cold phase). The following figure shows the annual AMO from 1958 to 2006 [http://intellicast.com/Community/Content.aspx?a=127] (See this link for more description of the AMO as well as the North Atlantic Oscillation and Arctic Oscillation).
The following figure shows the AMO from 1850 to 2008 [http://en.wikipedia.org/wiki/File:Amo_timeseries_1856-present.svg].
|
|
The AMO and North Atlantic Temperatures
The AMO affects regional temperatures in the Arctic area of the northern Atlantic. The following figure shows the temperature anomalies for the only 2 long-term stations in Iceland (from the NOAA GHCN database). Temperatures are recently approaching those observed in the 1930’s. The next figure compares the Iceland temperatures with the AMO shown previously. There is a strong correlation between the two.
The following figure shows the temperature anomalies for the available long-term or recent stations in Greenland (from the NOAA GHCN database). Temperatures are recently matching those observed in the 1930’s. The next figure shows the average temperature anomalies from those same stations, while the following figure compares the average anomalies with the AMO shown previously. Again, there is a strong correlation between the two.
|
|
The AMO and Atlantic Hurricanes
A USGS publication “Cycles of Hurricane Landfalls on the Eastern United States Linked to Changes in Atlantic Sea-surface Temperatures” [http://pubs.usgs.gov/circ/1306/pdf/c1306_ch2_a.pdf] states: “AMO variability is related to variation in density-driven, global ocean circulation patterns that involve movement of warm equatorial surface waters into high latitudes of the North Atlantic Ocean and the subsequent cooling and sinking of these surface waters into the deep ocean (thermohaline circulation). Warm phases of the AMO represent intervals of faster thermohaline circulation, which transports more warm equatorial waters to high latitudes of the North Atlantic. Cold phases of the AMO represent intervals of slower thermohaline circulation and thus less transport of warm equatorial waters to high latitudes of the North Atlantic.”
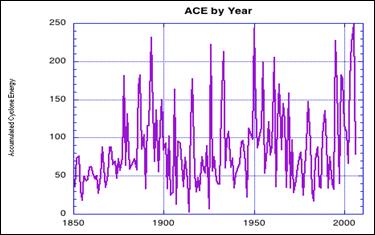
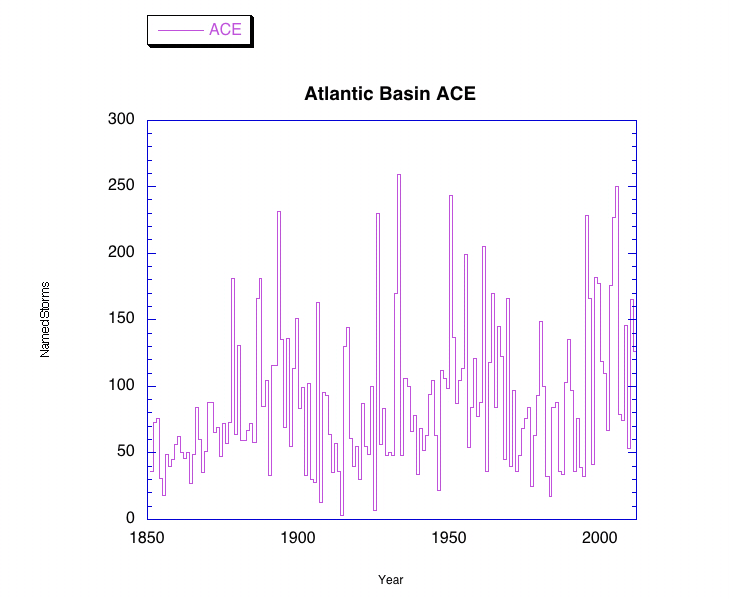
The following figure shows the Atlantic Basin Accumulated Cyclone Energy - ACE from [http://www.aoml.noaa.gov/hrd/tcfaq/ACE.jpg] The next figure superimposes the ACE on the AMO, illustrating the strong correlation.
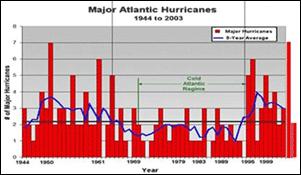
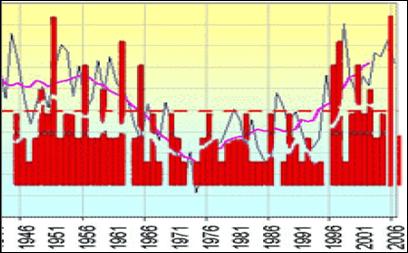
The following figure shows occurrence of major hurricanes in the Atlantic (right). The next figure superimposes the hurricane data on the AMO plot shown previously.
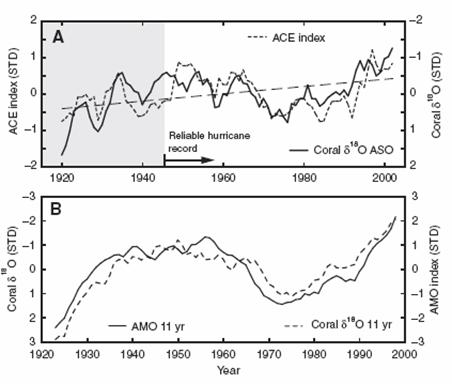
The following figure is from a study reported in 2008 using oxygen isotopes in Caribbean coral (“Caribbean Coral Tracks Atlantic Multidecadal Oscillation and Past Hurricane Activity”, Hetzinger et al, Geology 2008) [http://www.ifm-geomar.de/fileadmin/personal/fb1/me/nkeenlyside/paper/Hetzinger_etal_2008Geology.pdf]. The figure shows (A) a comparison between coral δ18O and the index of accumulated cyclone energy (ACE) for the North Atlantic averaged using a 5 yr running filter; and (B) a comparison between coral δ18O and the AMO index (North Atlantic SST averaged between 0 and 70°N) using an 11 yr running filter.
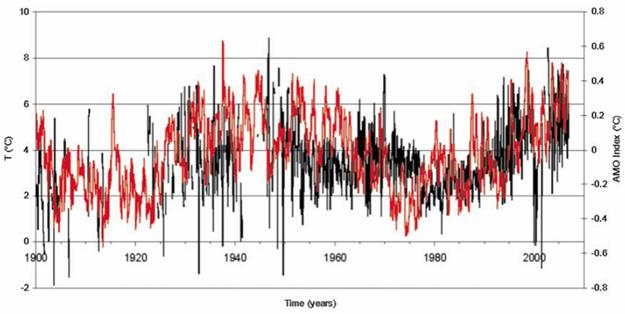
A study published in 2009 (Levitus et al: “Barents Sea multidecadal variability”, Geophysical Research Letters, Vol.36, 2009) provides the following figure showing “Monthly temperature (C) in the Barents Sea for the 100–150 m layer, from 1900 to 2006. Years without all 12 months of data are not plotted. The red line is the Atlantic Multidecadal Oscillation Index” [http://www.leif.org/EOS/2009GL039847.pdf]. This shows a strong correspondence between Arctic – Barents Sea – sea temperatures and the AMO.
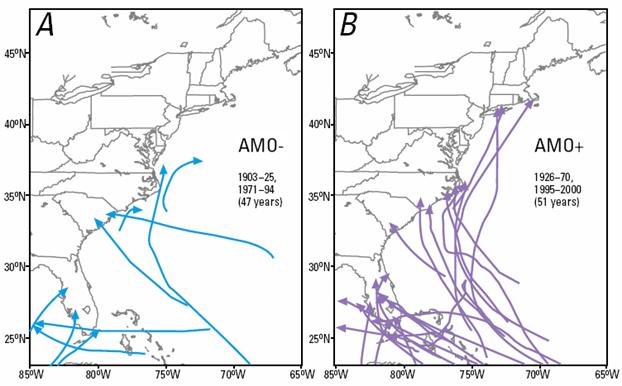
Cycles of Hurricane Landfalls on the Eastern United States Linked to Changes in Atlantic Sea-surface Temperatures (USGS) [http://pubs.usgs.gov/circ/1306/pdf/c1306_ch2_a.pdf]: “Historical observations suggest that the very active hurricane seasons of 2004 and 2005 may be part of a natural cycle in Earth’s climate system that is related to changes in mean sea-surface temperature (SST) in the North Atlantic Ocean.” The following figure compares landfalling major hurricanes for the negative and positive phases of the AMO.
Summary of 2008 Atlantic Tropical Cyclone Activity and Verification of Author’s Seasonal and Monthly Forecasts (Philip J. Klotzbach and William M. Gray, Department of Atmospheric Science Colorado State University, Nov. 2008) [http://tropical.atmos.colostate.edu/Forecasts/2008/nov2008/nov2008.pdf]: “The global warming arguments have been given much attention by many media references to recent papers claiming to show such a linkage. Despite the global warming of the sea surface that has taken place over the last 3 decades, the global numbers of hurricanes and their intensity have not shown increases in recent years except for the Atlantic. The Atlantic has seen a very large increase in major hurricanes during the 14-year period of 1995-2008 (average 3.9 per year) in comparison to the prior 25-year period of 1970-1994 (average 1.5 per year). This large increase in Atlantic major hurricanes is primarily a result of the multi-decadal increase in the Atlantic Ocean thermohaline circulation (THC) that is not directly related to global sea surface temperatures or CO2 gas increases. Changes in ocean salinity are believed to be the driving mechanism. These multi-decadal changes have also been termed the Atlantic Multidecadal Oscillation (AMO).”
|
|
The AMO and Other Climatic Phenomena
Many studies have shown that the major climatic events in the US are linked to cycles in ocean temperatures. Here are some AMO examples:
A Signature of Persistent Natural Thermohaline Circulation Cycles in Observed Climate (Knight et al, Geophysical Research Letters 32, 2005, [http://holocene.meteo.psu.edu/shared/articles/KnightetalGRL05.pdf]) states: “Using a 1400 year climate model calculation, we are able to simulate the observed pattern and amplitude of the AMO. The results imply the AMO is a genuine quasi-periodic cycle of internal climate variability persisting for many centuries, and is related to variability in the oceanic thermohaline circulation.”
Research Links Long Droughts In U.S. To Ocean Temperature Variations (United States Geological Survey (2004, March 10).) [http://www.sciencedaily.com/releases/2004/03/040310080316.htm]: “researchers believe that such large and sustained shifts in U.S. precipitation are linked with the natural variability of sea surface temperatures, the mechanisms are not well understood and cannot yet be used to help predict the likelihood of droughts. These sea surface temperature variations are characterized by climatic indices dubbed the Pacific Decadal Oscillation, or PDO, and the Atlantic Multidecadal Oscillation, or AMO. … Both negative and positive PDO "events" in the North Pacific Ocean tend to last 20-30 years, with recent research increasingly associating these events with regional temperature and precipitation variability across the country. … The researchers were able to correlate two of the three leading modes of drought frequency with PDO and AMO variations. … McCabe and his coauthors suggest that large-scale droughts in the United States are likely to be associated with positive AMO -- the kind of warming of sea surface temperatures that occurred over the North Atlantic in the 1930s, 50s, and since 1995.”
The AMO also influences rainfall in India and the African Sahel. The following figure is from a study Impact of Atlantic Multidecadal Oscillations on India/Sahel Rainfall and Atlantic Hurricanes (Zhang and Delwoth, Geophysical Research Letters, Vol. 33, 2006) [http://www.gfdl.noaa.gov/reference/bibliography/2006/roz0603.pdf] showing the correspondence between the AMO (a) and the Sahel rainfall (b), India rainfall (c) and hurricanes (e).
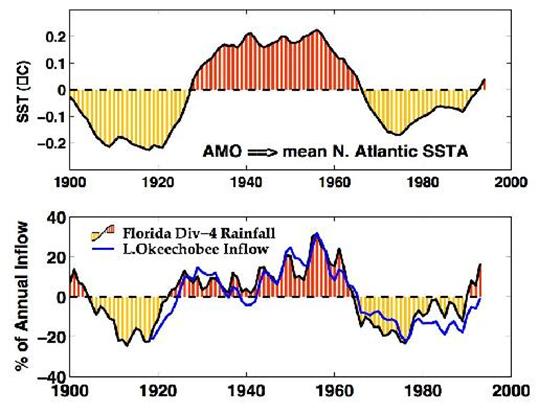
The following figure is from the NOAA AMO web site [http://www.aoml.noaa.gov/phod/amo_flarain.php]. The upper figure shows the AMO index since 1860, while the lower figure shows the smoothed anomaly of central Florida rainfall (shaded curve) and the amount of water flowing into Florida Lake Okeechobee. This shows the correlation between the AMO and the rainfall in Florida.
The following figure shows Mississippi River basin rainfall and outflow, which has been shown to be inversely correlated with the AMO
The next figure superimposes the inverted AMO shown previously, illustrating the strong negative correlation.
|